


For molecular modelers, ensuring protein structures are accurate and free from conformational strain is a crucial step before running simulations or performing analyses. One common challenge in protein modeling is identifying and correcting residues that occupy unfavorable backbone conformations. This is where the Interactive Ramachandran Plot in SAMSON becomes an essential tool, offering a visual and interactive way to inspect and refine backbone dihedral angles.
What Is a Ramachandran Plot?
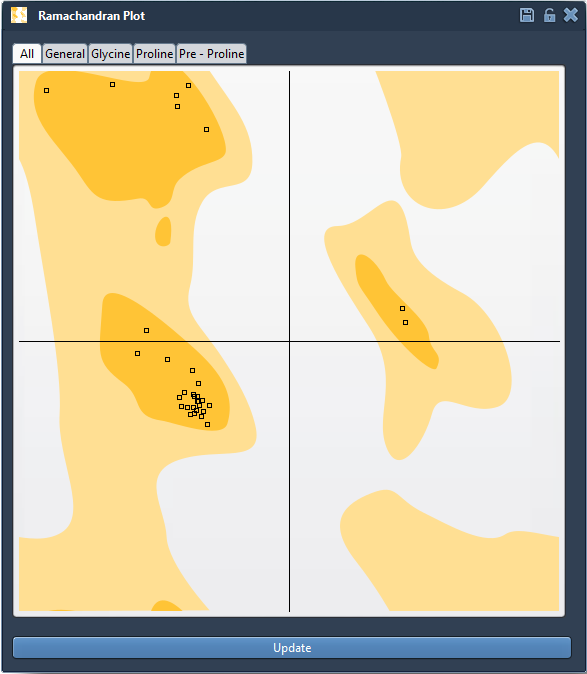
A Ramachandran plot is a staple tool in structural biology. It shows the φ (phi) and ψ (psi) dihedral angles of amino acid residues in a protein and indicates whether their conformations fall in energetically favorable regions. Yellow areas in the plot represent conformational spaces that are sterically and energetically allowed, while white areas highlight strained or disallowed configurations. This makes the plot invaluable for identifying residues with problematic dihedral angles.
Interactive Features of the Ramachandran Plot
SAMSON’s Interactive Ramachandran Plot takes this classic tool to the next level. It not only lets you visualize dihedral angles in real-time, but also enables you to edit conformations directly from the plot for immediate feedback on how changes affect the protein structure in 3D. Here’s how it works:
Explore Individual Residues
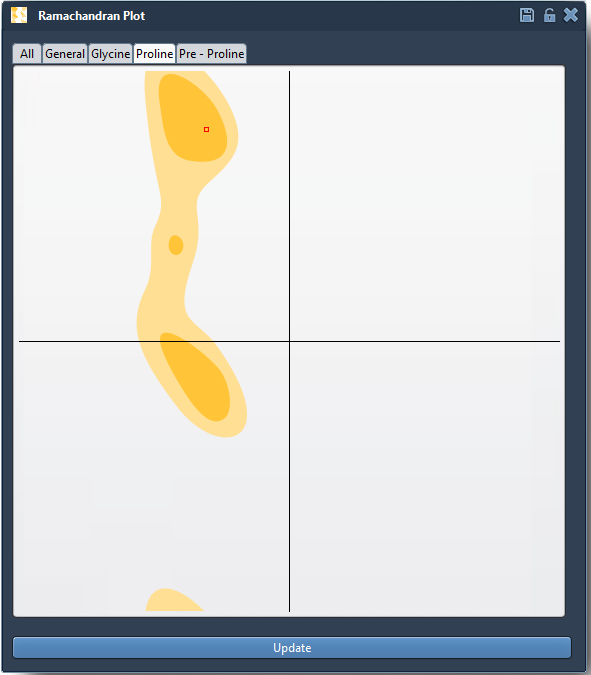
Each dot on the plot represents a residue in the protein. Clicking on a dot highlights and selects the corresponding residue in the 3D viewport, allowing you to examine its φ and ψ angles and review how it interacts with neighboring residues. This feature is helpful for isolating regions with strained geometry, such as prolines or pre-proline residues, that can influence overall structural stability.
Interactive Editing Options
There are two ways to correct or optimize residues right from the plot:
- Drag points directly in the plot: Simply click and drag a residue’s representation within the plot to reposition it into a favored region. SAMSON instantly updates the protein model in 3D, giving immediate feedback on the new conformation.
- Use the Twister Editor: For more intuitive and 3D-based manipulation, the Twister Editor allows you to twist the protein in the viewport while simultaneously observing changes in the plot. This provides a seamless workflow to refine local geometries.
Tips for Model Optimization
Properly utilizing the Ramachandran plot in SAMSON can drastically improve the quality of your protein model. Here are some tips to get the most out of it:
- Use the plot early in the modeling pipeline to validate and refine homology models by fixing residues in unfavorable regions.
- Combine this tool with other analyses, like nonlinear normal modes for global and local optimization. For instance, you can identify residues strained due to global motion and correct them using the plot.
- Pay attention to functionally important regions like active sites or binding pockets, where accurate conformational flexibility can significantly impact downstream predictions.
Applications in Protein Modeling
With the Interactive Ramachandran Plot, molecular modelers can:
- Detect strained residues: Identify regions with disallowed dihedral angles before simulations to avoid artifacts that stem from poor starting geometries.
- Refine homology models: Clean up outliers from automated modeling pipelines that often produce sterically strained residues.
- Understand flexibility: Investigate the conformational behavior of residues in functionally critical areas.
Get Started
The Interactive Ramachandran Plot is highly intuitive, making it accessible to novice and expert modelers alike. To learn more about setting it up and using it in SAMSON, visit the full documentation at this link.
SAMSON and all SAMSON Extensions are free for non-commercial use. Download SAMSON today at SAMSON Connect.