



For molecular modelers, ensuring that protein structures are free of strained conformations is vital. The Ramachandran Plot is a cornerstone tool for visualizing the allowed backbone dihedral angles, but wouldn’t it be helpful to not just inspect but also directly adjust these angles in real time? That’s where the Interactive Ramachandran Plot SAMSON Extension shines.
What is a Ramachandran Plot?
The Ramachandran Plot visualizes the energetically allowed conformations of a protein’s backbone based on its φ (phi) and ψ (psi) dihedral angles. Regions in the plot highlight favored and disfavored conformations, which helps modelers assess if amino acid residues are positioned optimally.
Streamlining Protein Modeling with Interaction
The Interactive Ramachandran Plot Extension empowers you to not only visualize but also edit protein backbone conformations directly within the plot. This capability is perfect for tasks such as structure refinement or fixing outliers from homology models and provides real-time feedback on your adjustments.
How It Works
Drag and Modify in the Plot
- Click on a residue represented as a dot on the plot to select it.
- Drag the dot to adjust its φ and ψ angles in real time, reflecting the changes immediately in the protein’s 3D structure.
- Undo undesired edits using Ctrl/Cmd + Z.
This interactivity provides an intuitive way to make fine adjustments to specific residues while observing the effects on the overall structure.
Using the Twister Editor
- Select the Twister Editor tool from the left-hand menu in the SAMSON viewport.
- Interactively twist your protein’s chain in 3D space while keeping an eye on the real-time updates in the Ramachandran Plot.
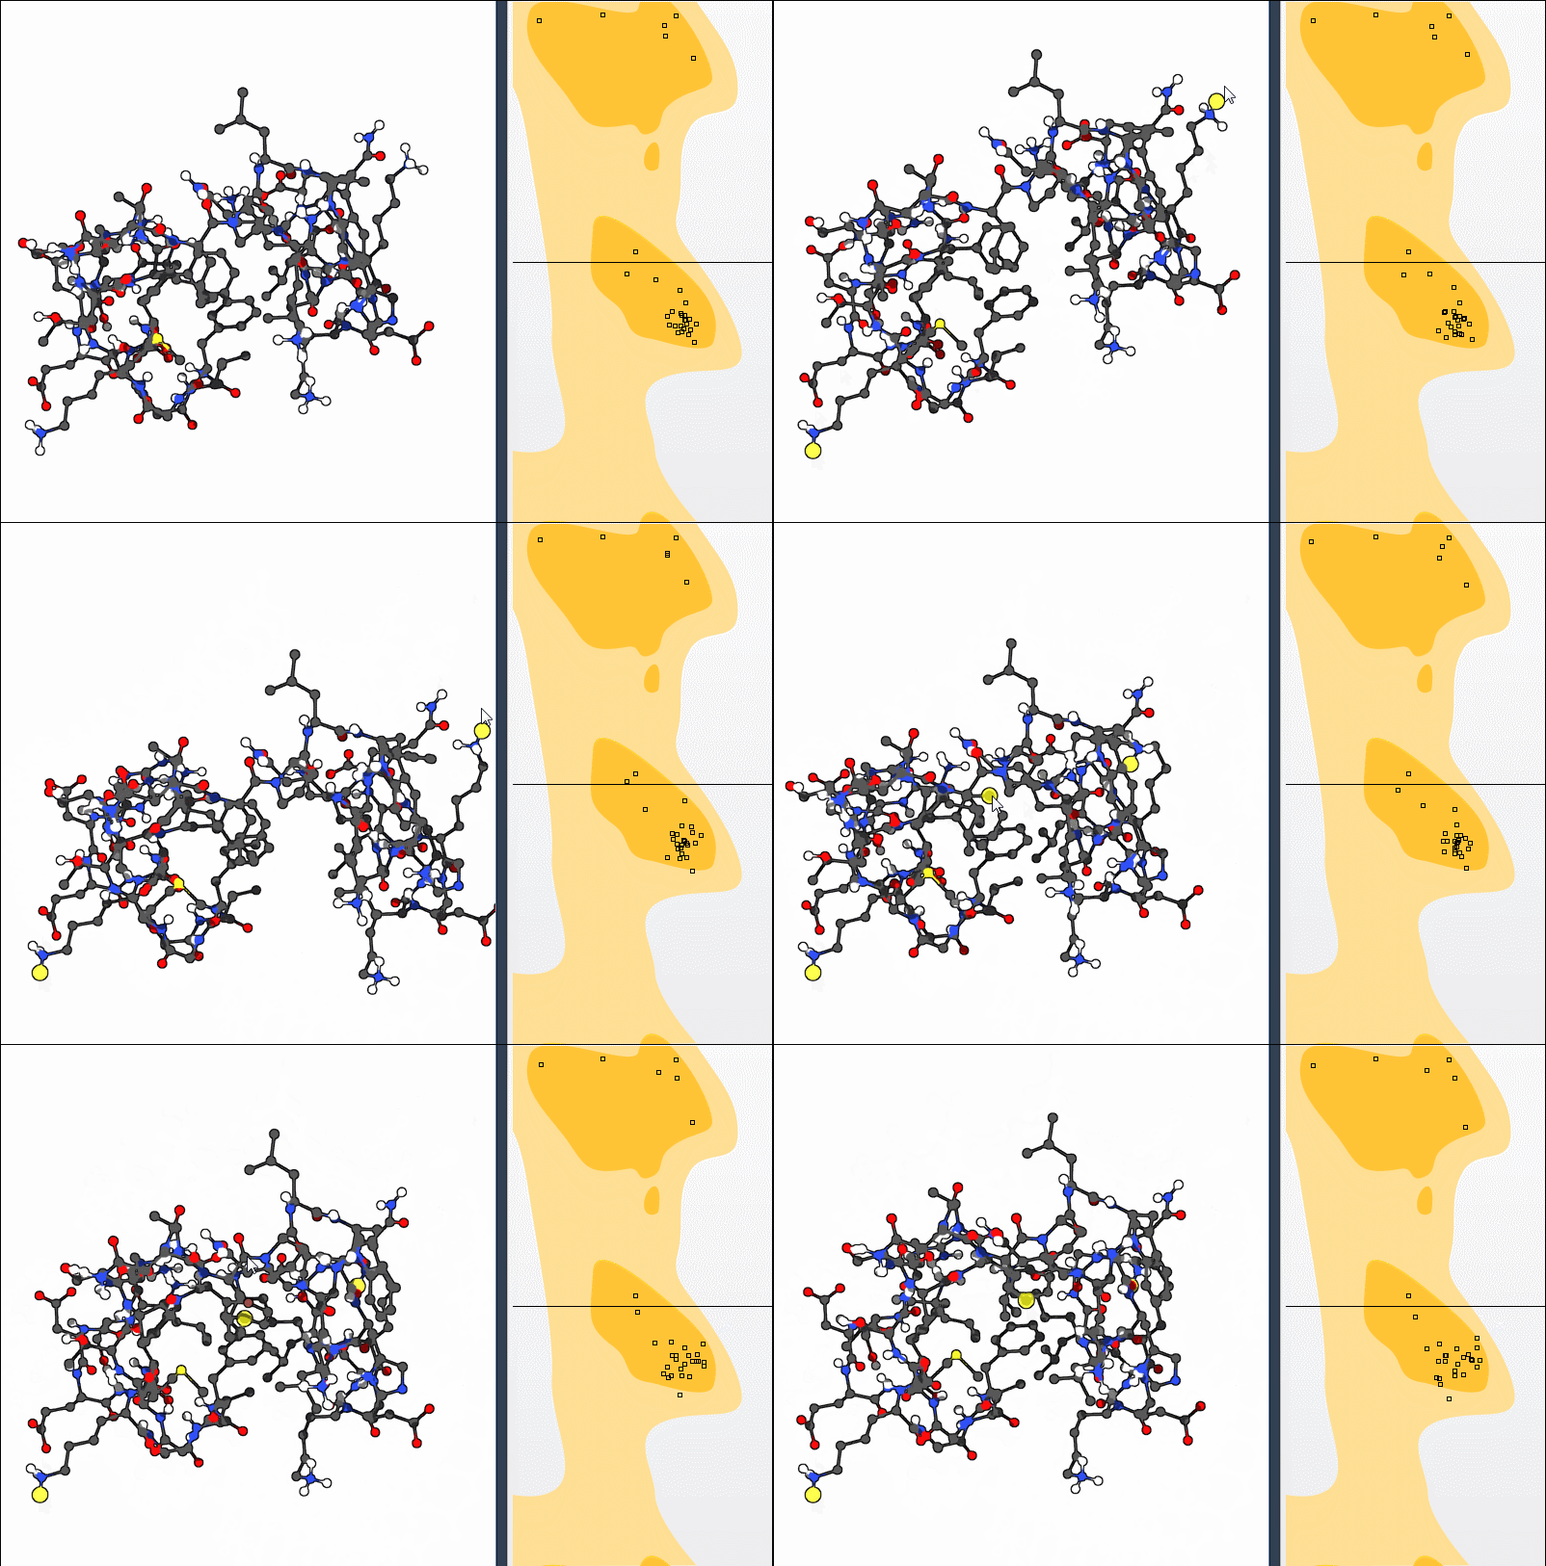
This approach is ideal for exploring larger-scale backbone adjustments!
Example Use Case: Refining Protein Structure
Imagine you’ve just generated a homology model or prepared a structure manually. Some residues may fall into white regions of the Ramachandran Plot, indicating strained or disallowed conformations. Using the steps above, you can adjust these residues – whether by directly dragging in the plot or working through Twister Editor – so they shift into energetically favorable regions (yellow areas).
Powerful Integration with Normal Modes
For a more intricate exercise, combine the Ramachandran Plot with nonlinear normal mode calculations to address global and local structural issues:
- Load the protein structure of interest.
- Compute nonlinear normal modes to explore global movements (see the documentation on Calculating Nonlinear Normal Modes).
- Apply these normal modes to adjust the backbone, and use the Ramachandran Plot App to fine-tune the residues into stable conformations.
This combination provides both a global and detailed approach to refining proteins to ensure they are simulation-ready.
Learn More
The Interactive Ramachandran Plot makes validating and adjusting protein structures faster and simpler. For detailed instructions, examples, and advanced tips, visit the documentation page: Ramachandran Plot Documentation.
Note: SAMSON and all SAMSON Extensions are free for non-commercial use. Download SAMSON at https://www.samson-connect.net.