



For molecular modelers and simulation enthusiasts, turning simulation data into actionable insights is often a critical task. Imagine running comprehensive umbrella-sampling simulations, only to face challenges in producing accurate and meaningful Potential of Mean Force (PMF) profiles. This process, while integral to understanding reaction coordinates, can be cumbersome without the right tools. Enter GROMACS Wizard’s PMF Analysis—a step-by-step solution designed to simplify the workflow of PMF computation, all while saving users precious time and effort. Let’s dive into the core process to help you succeed.
The Problem
The main challenge lies in converting the raw windowed simulation data from an umbrella sampling workflow into a meaningful PMF profile. Without an intuitive computing framework, this process is prone to errors and inefficiencies. Questions like “Are my simulation windows well-aligned with the reaction coordinate?” or “How should I customize parameters for better results?” can make PMF analysis seem overwhelming.
The Solution: Using GROMACS Wizard’s WHAM Tool
GROMACS Wizard simplifies PMF analysis using the Weighted Histogram Analysis Method (WHAM). Instead of juggling command line inputs and custom scripts, you can handle the computation through a guided user interface. Here’s a quick walkthrough:
Preparing Your Input
Before starting, verify that:
- You’ve completed an umbrella-sampling workflow.
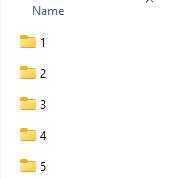
- Your input folder contains matching subprojects for the same system and reaction-coordinate setup. You should see the numbered subfolders organized neatly.
Performing the PMF Analysis
Once your input data is ready, navigate to the WHAM Analysis tab in GROMACS Wizard. Here’s what you need to do:
- Choose the project path manually or click the auto-fill button (
 ) to load data from a previous umbrella-sampling workflow.
 - Verify that the folder structure aligns with system and reaction-coordinate parameters.
- Select the reaction coordinate from the list provided by GROMACS Wizard.
- Adjust optional settings like time range or energy units (if needed).
- Click Compute—and that’s it!
Depending on the size of your trajectory files, computing the PMF may take several seconds or minutes.
Visualizing and Interpreting Results
Once the computation is complete, GROMACS Wizard produces two insightful plots:
- The PMF profile, which shows free energy along the reaction coordinate.
- A histogram indicating the coverage of the reaction-coordinate space.
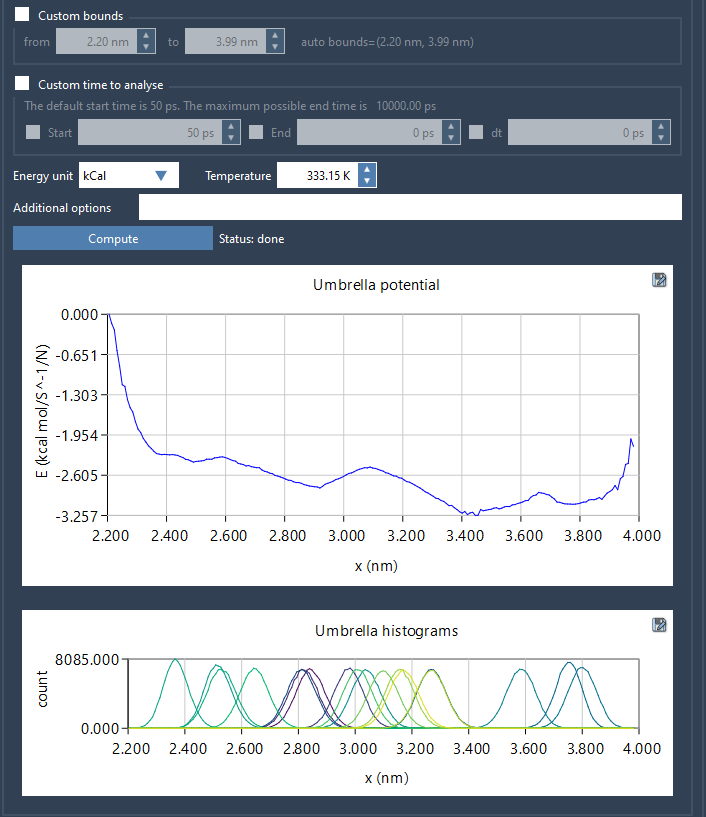
Pay close attention to the histogram: regions with sparse sampling may require additional simulations. If so, you can return to your umbrella-sampling setup and create new windows to improve coverage. The tool even reuses pre-computed data, making the process iterative and efficient.
Why This Matters
Performing PMF analysis with WHAM through GROMACS Wizard is not just about obtaining data—it’s about ensuring you derive meaningful insights that inform your studies. Whether you’re investigating ligand binding, conformational changes, or reaction pathways, robust PMF analysis lays the groundwork for reliable conclusions.
To dig deeper into GROMACS Wizard’s PMF analysis tools, visit the official documentation page here: https://documentation.samson-connect.net/tutorials/gromacs-wizard/pmf-analysis/.
SAMSON and all SAMSON Extensions are free for non-commercial use. You can get SAMSON at https://www.samson-connect.net.