



When working with molecular simulations, understanding the energy landscape of reactions and pathways is a crucial task. One powerful way to gain such insights is by creating a Potential of Mean Force (PMF) profile. But how do you go from simulation data to meaningful PMF plots efficiently? This blog post dives into the process of PMF analysis using the GROMACS Wizard in SAMSON, helping molecular modelers streamline their workflow.
What Is PMF Analysis and Why Is It Important?
PMF profiles offer quantitative insights into the free energy landscape along a reaction coordinate. They are especially useful in studying processes like ligand binding, protein conformational changes, or reaction dynamics. Once you’ve completed an umbrella sampling simulation, PMF analysis allows you to consolidate all the data and interpret it in terms of energy barriers and stable states. However, preparing and analyzing this data manually can be daunting.
Simplifying PMF Analysis with GROMACS Wizard
In GROMACS Wizard, PMF analysis is performed using the Weighted Histogram Analysis Method (WHAM). This tool makes it possible to handle the complexities of such analyses in just a few steps.
Step-by-Step Process
- Navigate to the WHAM Analysis tab in GROMACS Wizard. If you’ve just completed an umbrella sampling workflow, use the auto-fill feature (
 ) to automatically specify the project path and input files.
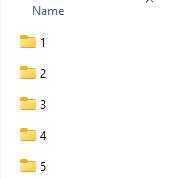
 - Verify that your input folder contains numbered subprojects corresponding to the same system and reaction-coordinate setup. This ensures all prepared data is in order. Here’s an example of a well-organized input folder:
- Select your desired reaction coordinate from the list. This step allows GROMACS Wizard to focus on the right data for computation.
- Fine-tune optional settings such as bounds, time ranges, or energy units specific to your analysis needs. These customizations can enhance the precision or relevance of your results.
- Click Compute and let GROMACS Wizard do the heavy lifting. Depending on the size of your trajectory data, this may take anywhere from a few seconds to a few minutes.
Visualizing and Interpreting Results
Once the computation is complete, GROMACS Wizard generates two key plots:
- A PMF profile showing the energy landscape along the reaction coordinate.
- A histogram to illustrate how well the reaction-coordinate space is covered during the simulations.
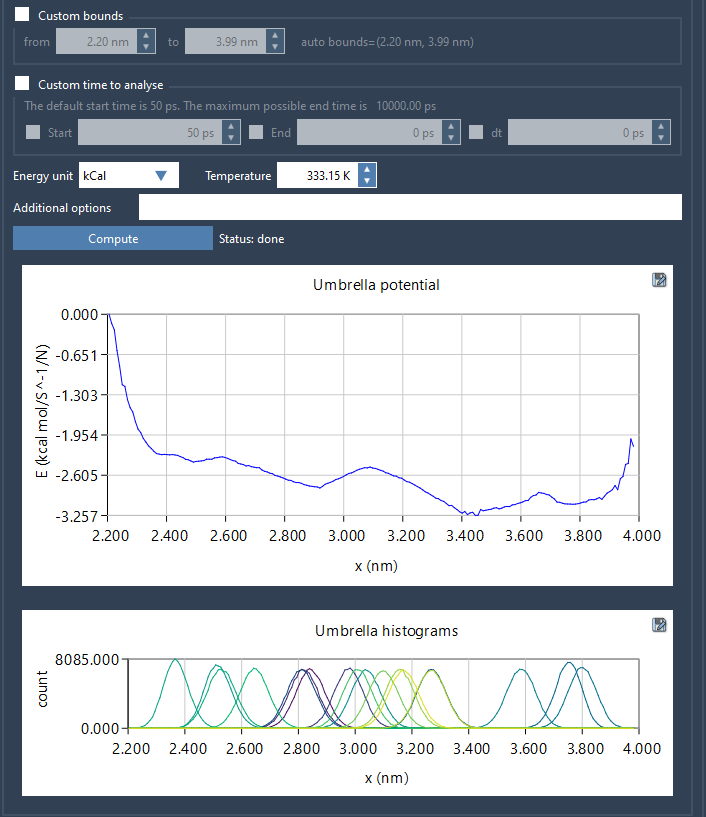
The histogram is particularly useful for identifying areas that may require additional sampling. If any regions of your reaction coordinate are under-sampled, you can return to your umbrella sampling workflow to collect more data in those areas.
Saving and Reusing Results
After computation, GROMACS Wizard automatically saves the profiles, histograms, and plots in the wham_results subfolder of your project. If you later decide to switch between reaction coordinates, GROMACS Wizard uses already computed data for the same parameters, saving you time and effort.
Conclusion
PMF analysis is an indispensable step in many molecular modeling workflows, and GROMACS Wizard simplifies the process for modelers by automating cumbersome calculations and providing intuitive visualizations. To delve into this feature and see the detailed documentation, visit the official page: GROMACS Wizard – PMF Analysis documentation.
SAMSON and all SAMSON Extensions are free for non-commercial use. Get SAMSON at https://www.samson-connect.net.