


For molecular modelers, keeping track of structural transformations in proteins is crucial, especially when analyzing dynamics, folding mechanisms, or the effects of mutations. How do you efficiently quantify the backbone’s structural state over an entire trajectory? This is where the Secondary Structure Content feature of SAMSON’s Path Analyzer comes in.
What is Secondary Structure Content?
The Secondary Structure Content tool provides a high-level summary of how much of a protein’s structure is in alpha-helices, beta-sheets, or remains unstructured—updated for each frame of your simulation. This makes it particularly useful for tracking backbone state changes through time.
When and Why to Use It
- Use this analysis for protein-wide behavior summaries. For example, observe large-scale folding events in molecular dynamics simulations.
- Narrow your selection to specific regions, such as helix bundles or loop-rich domains, if you are studying localized state changes.
By visualizing the percentage of alpha, beta, and unstructured residues over time, the tool offers an accessible overview to identify significant structural trends or pinpoint interesting timeframes for further investigation.
How to Add the Secondary Structure Plot
Following these simple steps will allow you to add and customize a Secondary Structure Content plot:
- Open the Path Analyzer in SAMSON.
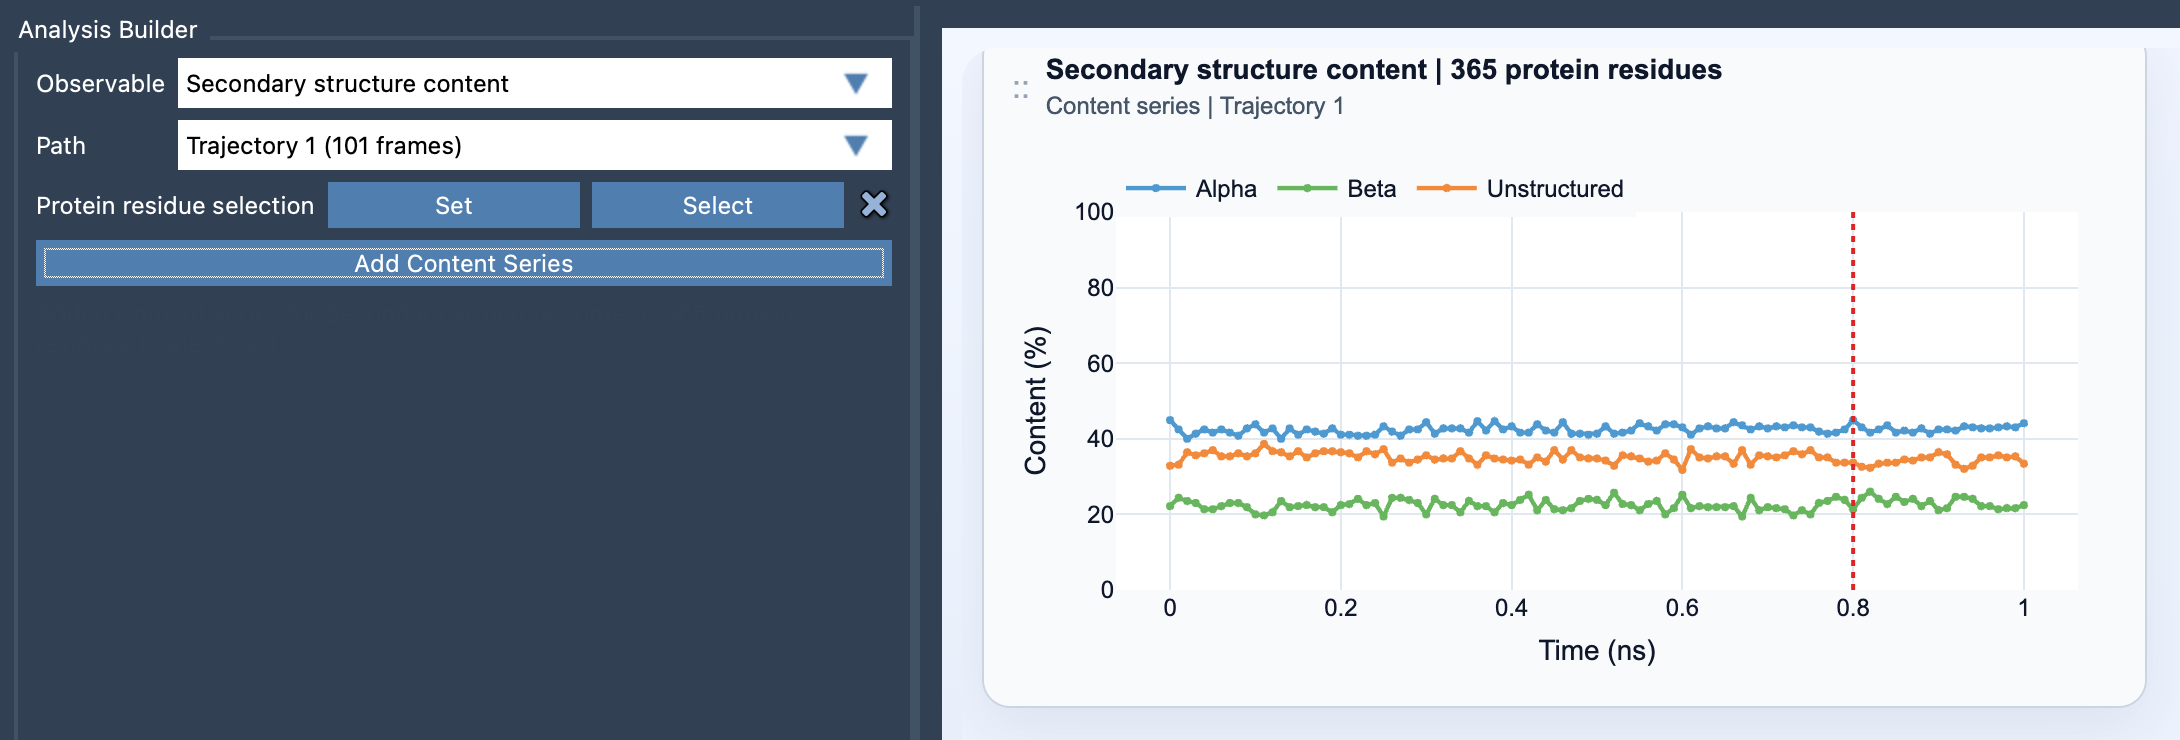
- Select Secondary structure content under the Observable menu.
- Choose the Path you want to analyze (e.g., a timeline from molecular dynamics).
- Define the Protein residue selection.
- Click Add Content Series to generate the time-series plot.
Understanding the View and Outputs
The plot displays percentages of alpha, beta, and unstructured residues over time—all values are normalized to the total number of the selected protein residues.
Alpha (%):Percentage of selected residues in alpha-helical structures at a given frame.Beta (%):Percentage in beta-sheet structures.Unstructured (%):Percentage in unstructured conformation.
The elegance of the tool lies in its simplicity: it enables you to extract meaningful insights from complex data and better understand structural changes.
Enhancing Your Analysis
Pairing this analysis with other tools, such as Ramachandran plots, offers an even deeper dive into residue-level dynamics. This combination can shed light on structural transitions and their underlying backbone configurations.
Tips for Effective Use
- For an overview of the entire protein, select all residues. This works great for large unfolding or refolding events.
- To target smaller regions, focus on specific residues (e.g., a domain or loop). This is helpful for understanding the behavior of localized structural elements.
By leveraging focused selections and combining tools, you can build a rich picture of molecular dynamics for your research.
To learn more about the Secondary Structure Content feature, visit the official documentation page.
SAMSON and all SAMSON Extensions are free for non-commercial use. Download SAMSON at https://www.samson-connect.net.