


Tracking Molecular Motion Made Simple
Analyzing molecular motion, particularly ligand unbinding, can be a challenge for molecular modelers. Understanding how molecules like ligands leave a binding site or how protein domains shift during conformational changes often demands custom visualization. This is where SAMSON’s Pathlines visual model comes in, offering a solution to represent and study the motion of a system’s center of mass (COM).
Why Pathlines Matter
The Pathlines visual model makes it easier to analyze complex molecular dynamics. For example, consider the case of ligand unbinding pathways. Instead of struggling to mentally reconstruct the COM trajectory of selected atoms, Pathlines can do it for you, visually mapping the motion across simulations. This same feature is invaluable for processes such as diffusion visualizations or analyzing macromolecular conformational changes.
Step-by-Step Guide to Creating Pathlines
You can begin creating and exploring Pathlines in SAMSON by following this simple process:
Step 1 – Load the Sample System
SAMSON offers a sample system for practice. Here’s how to load it:
- In SAMSON, go to Home > Download.
- Paste this URL: https://www.samson-connect.net/documents/046f1acd-c799-40f6-8185-cb4847eff795 and click Download.

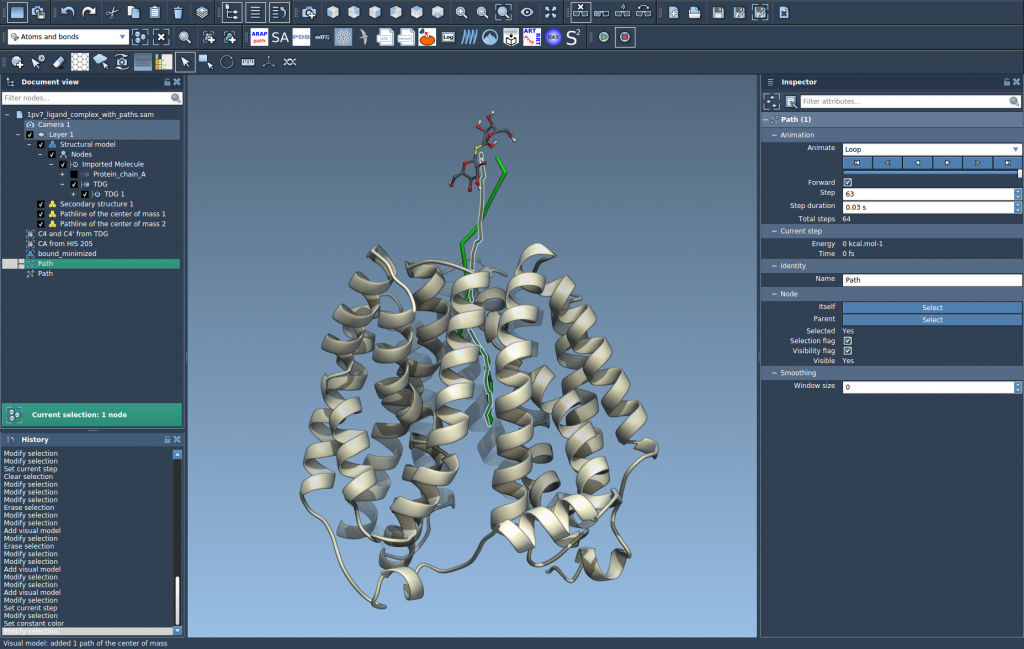
The sample contains a lactose permease protein (1PV7), its ligand Thiodigalactosid (TDG), and ligand unbinding paths generated with the Ligand Path Finder. The Document view in SAMSON will show atoms and paths for exploration.
Step 2 – Select Atoms and Paths
Decide which group of atoms to analyze:
- In the Document view, select the atoms whose COM should be tracked.
- Hold Ctrl or Cmd to select multiple paths simultaneously.

If no atoms or paths are selected, SAMSON defaults to using the entire system and all paths in your document.
Step 3 – Generate the Pathline Visual Model
Next, create the visual model for tracking the COM motion:
- Navigate to Visualization > Visual model > More… (shortcut: Ctrl or Cmd + Shift + V).
- Choose Pathline of the center of mass and click OK.

This step will create a pathline showcasing the COM trajectory along the selected paths.
Step 4 – Customize and Explore
Pathlines can be adapted to better suit your specific analysis:
- You can double-click on a path in the Document view to play or stop it.
- Right-click a path for additional context menu options under Path > ….
- Use the Inspector (Ctrl / Cmd + 2) to access settings for visual model thickness, color, and other attributes.
Applications of Pathlines
Pathlines are versatile tools in molecular modeling. They have been widely used for:
- Tracking ligand unbinding or rebinding routes.
- Visualizing collective domain motions in large protein complexes.
- Analyzing center-of-mass movement in reaction coordinate workflows.
Ready to Dive In?
Pathlines provide a detailed yet intuitive way to study molecular motion. To explore Pathlines further and unlock their full potential, visit the official documentation page.
Note: SAMSON and all SAMSON Extensions are free for non-commercial use. Start modeling today by downloading SAMSON at https://www.samson-connect.net.