


In molecular modeling, understanding how different features interact over time is a central challenge. Whether you’re studying protein-protein interfaces, observing ligand binding, or tracing changes in molecular packing, tracking contacts can provide significant insights. That’s where Contact Analysis in the Path Analyzer tool of the SAMSON platform becomes a powerful ally.
Why Track Molecular Contacts?
One of the most common bottlenecks in molecular simulation work is identifying when and where interactions between molecular features are occurring. For example, if you’re investigating a drug binding to its target protein, you need to know precisely when key binding residues are in contact. Tracking interactions helps pinpoint binding events, structural changes, and domain-domain interactions that are critical to your research.
The Contact Analysis feature in SAMSON enables you to:
- Track the number of feature pairs in contact at each simulation frame.
- Visualize the occupancy of those contacts using a clear and informative heatmap.
- Analyze structural stability through breaking and forming interactions over time.
This feature is particularly useful for identifying subtle structural changes at molecular interfaces that are otherwise easy to miss.
How to Add and Use the Contact Analysis Plot
The Contact Analysis tool is simple to set up but highly informative. Here’s how you can make the most of it:
- Open the Path Analyzer interface in SAMSON.
- Select Contacts under the Observable menu.
- Define your target groups: Group A and Group B. These groups represent the sets of features you wish to analyze for interactions.
- Specify the contact cutoff distance in Angstroms (Å). This will determine the threshold below which atoms in Groups A and B are considered to be in contact.
- Click either Add Contact Series to track contacts over time or Add Contact Map to reveal the occupancy frequency across features.
Visualizing the Results
Contact Analysis offers two key visualization modes:
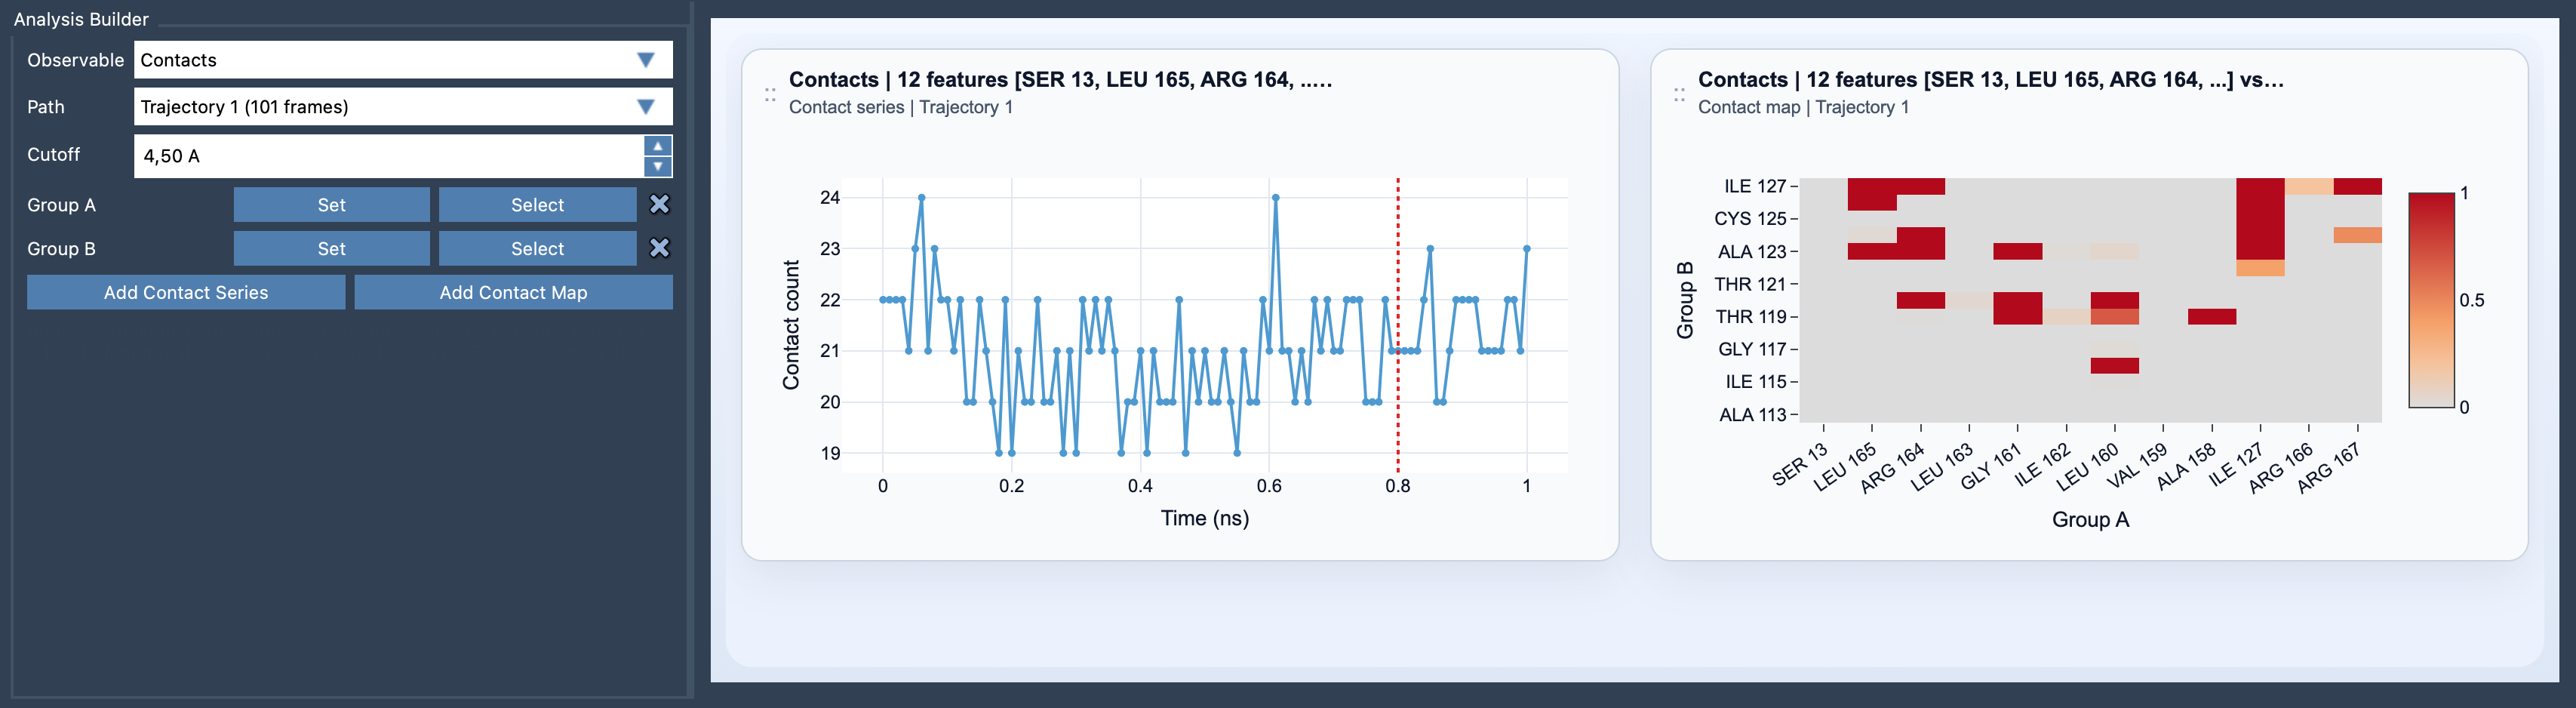
- Contact Series: This creates a time-resolved plot showing the total number of contacts per frame. It’s ideal for spotting exactly when an interface forms or breaks.
- Contact Map: This summarizes the occupancy of specific feature pairs across an entire simulation. Each feature pair’s interaction frequency is represented as a heatmap, making it easy to identify critical residues or domains.
For example, in a protein-ligand interaction, a contact series might reveal the exact moment binding occurs, while a contact map can show which amino acid residues contribute most to the interaction (e.g., through hydrogen bonding or van der Waals contacts).
Practical Tips for Getting the Most Out of Contact Analysis
Here are some tips for leveraging this tool effectively in your modeling workflow:
- Choosing groups wisely: Select specific residues, domains, or chains instead of general atom clouds. Focused selections lead to more interpretable plots.
- Detecting and interpreting patterns: Use the contact series to identify key moments in your simulation. Once you know when significant changes occur, zoom in on those frames for structural analysis.
- Combining with other analyses: Pair contact maps with complementary tools like Contact Persistence for a binary time history of interactions.
Learn More
With Contact Analysis in SAMSON, molecular modelers have a robust tool for understanding complex interactions. From monitoring protein interfaces to assessing ligand binding patterns, this feature streamlines the process and adds clarity to your study of dynamic systems.
For more details, explore the official documentation page at SAMSON Docs – Contact Analysis.
SAMSON and all SAMSON Extensions are free for non-commercial use. You can download SAMSON at SAMSON Connect.