


Monitoring protein backbone changes over time can reveal crucial insights into molecular dynamics. If you’re dealing with complex molecular models and wondering how to track structural shifts in a protein selection—whether it’s alpha helices, beta sheets, or unstructured regions—the Secondary Structure Content analysis in SAMSON’s Path Analyzer is an excellent tool for this.
Why Monitor Secondary Structure Content?
Proteins undergo constant conformational changes that play key roles in their function. Tracking how much of a protein selection remains in an alpha-helix, beta-sheet, or unstructured state can help you identify key moments in simulations where structural transitions happen.
Using Secondary Structure Content, you gain a time-series view of these changes. This approach is not only useful for summarizing large data but also for spotting specific details like transitions in flexible loop regions or tracking folding/unfolding events in proteins relevant to your study.
Whether you’re analyzing a whole protein or focusing on specific regions, this feature offers customizable insights tailored to your data needs.
Setting It Up
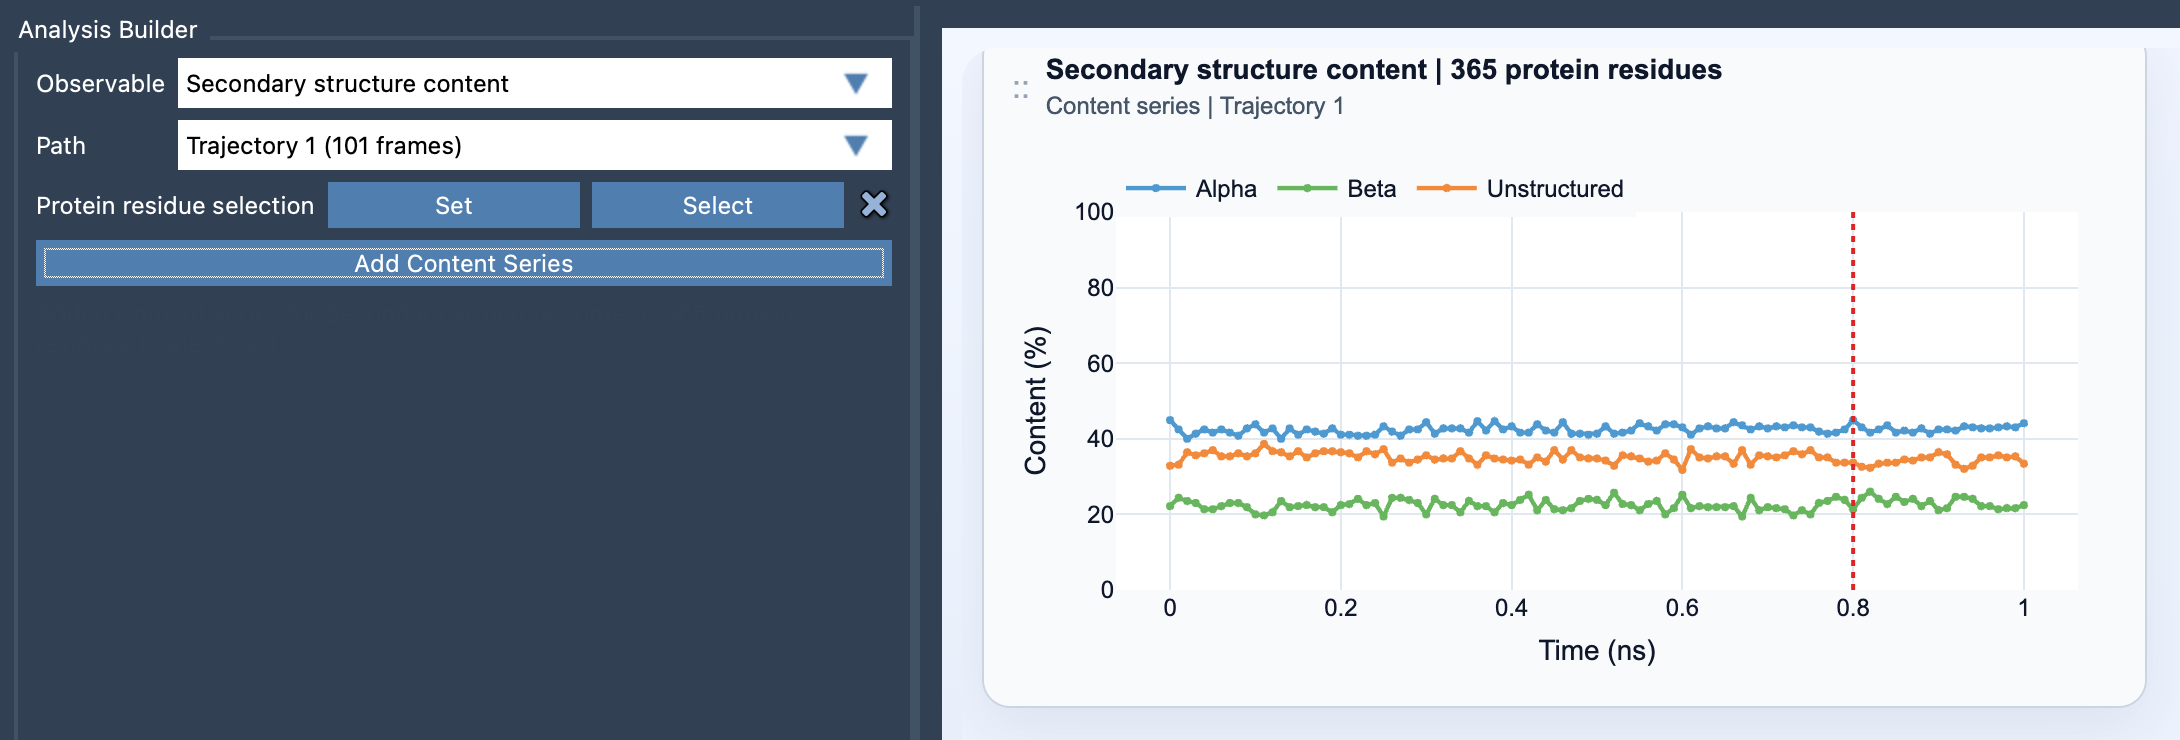
Adding a Secondary Structure Content plot in SAMSON’s Path Analyzer is straightforward. Here’s how to get started:
- Open the Path Analyzer interface.
- Select Secondary structure content as the Observable.
- Choose your protein’s Path (e.g., predefined trajectories in your project).
- Define a Protein residue selection. This could be the entire protein, a domain of interest, or a loop-rich region.
- Click Add Content Series to generate the time plot.
Voilà! You now have a visual representation showing the percentage of residues that fall under alpha, beta, or unstructured categories over time.
What To Expect?
By default, the plot is a multi-series time graph where each line represents the percentage of residues in a specific structural state (0 to 100% scale). For instance:
Alpha: Tracks residues forming helices.Beta: Tracks residues forming beta sheets.Unstructured: Tracks residues in disordered or loop conformations.
The flexibility of Secondary Structure Content enables both broad and refined analysis. For protein-wide summaries, make a broad residue selection. To study specific functional domains, focus on localized selections like helix bundles or loops.
Pro Tip!
Want residue-specific details in addition to this high-level summary? Pair the Secondary Structure Content analysis with a Ramachandran analysis in SAMSON. This gives you a complementary view—a detailed residue-level perspective alongside the overarching secondary structure trends.
Learn More
Ready to explore the Secondary Structure Content feature further? Dive into the complete details in the original documentation.
SAMSON and all SAMSON Extensions are free for non-commercial use. You can get it now at samson-connect.net.