


Tracking molecular interactions is a pivotal aspect of molecular modeling, whether you are studying ligand binding, domain motions, or protein dynamics. Typically, researchers face the challenge of quantifying how different molecular groups move in relation to one another — a task that can become increasingly complex along dynamic paths or trajectories. This is where the Distance feature in SAMSON’s Path Analyzer comes into play, providing a straightforward yet versatile toolkit for measuring distances with precision tailored to your goals.
What is the Distance Analysis Tool?
The Distance tool in SAMSON allows you to quantify how far apart two groups are along a specific path or trajectory. This feature is invaluable for modeling scenarios such as tracking binding-site opening and closing, investigating inter-domain motions, or observing the approach of two specific features within complex biological systems.
In essence, the tool provides multiple distance metrics, including centroid-based distances and minimum distances (general or axis-specific). Each of these options is tailored to address specific modeling questions, offering either a high-level smoothed descriptor or chemically precise contact tracking.
How to Set Up Distance Analysis
Using the Distance tool is intuitive. Here’s a quick guide:
- Start by opening the Path Analyzer.
- Select Distance as the observable measurement mode.
- Specify a Path to analyze.
- Choose two groups, Group A and Group B, for your analysis. These could range from individual atoms to entire protein chains, depending on the desired resolution.
- Select a Distance type (e.g.,
Centroids,Minimum, or axis-specific options such asMinimum along X). - Add your analysis as a Time Series (distance evolution over time) or as a Histogram (distribution of distances).
Choosing the Right Distance Type
The Distance tool comes equipped with flexible options tailored for different scenarios:
- Centroids: Useful when a smooth, high-level descriptor of group motion is sufficient. This mode uses the geometric average of atom positions in each group.
- Minimum: Ideal if your analysis focuses on the closest points of contact between two groups rather than their overall displacement.
- Minimum along Axis: These options (X, Y, or Z) are indispensable when tracking motion along a preferred spatial direction, helping you separate specific components of motion.
The choice between these distance types ensures the tool can meet a wide range of modeling needs, from simplified high-level tracking to detailed analysis of dynamic motion.
Visualizing Your Data
The Distance tool isn’t just about calculating numbers — it’s about making those numbers meaningful. You can visualize results in the following ways:
- Time Series: Monitor how the distance between two groups evolves along the chosen path or trajectory, offering insights into dynamic processes such as ligand docking or conformational changes.
- Histogram: Analyze the distribution of sampled distances to uncover trends or periodic behaviors.
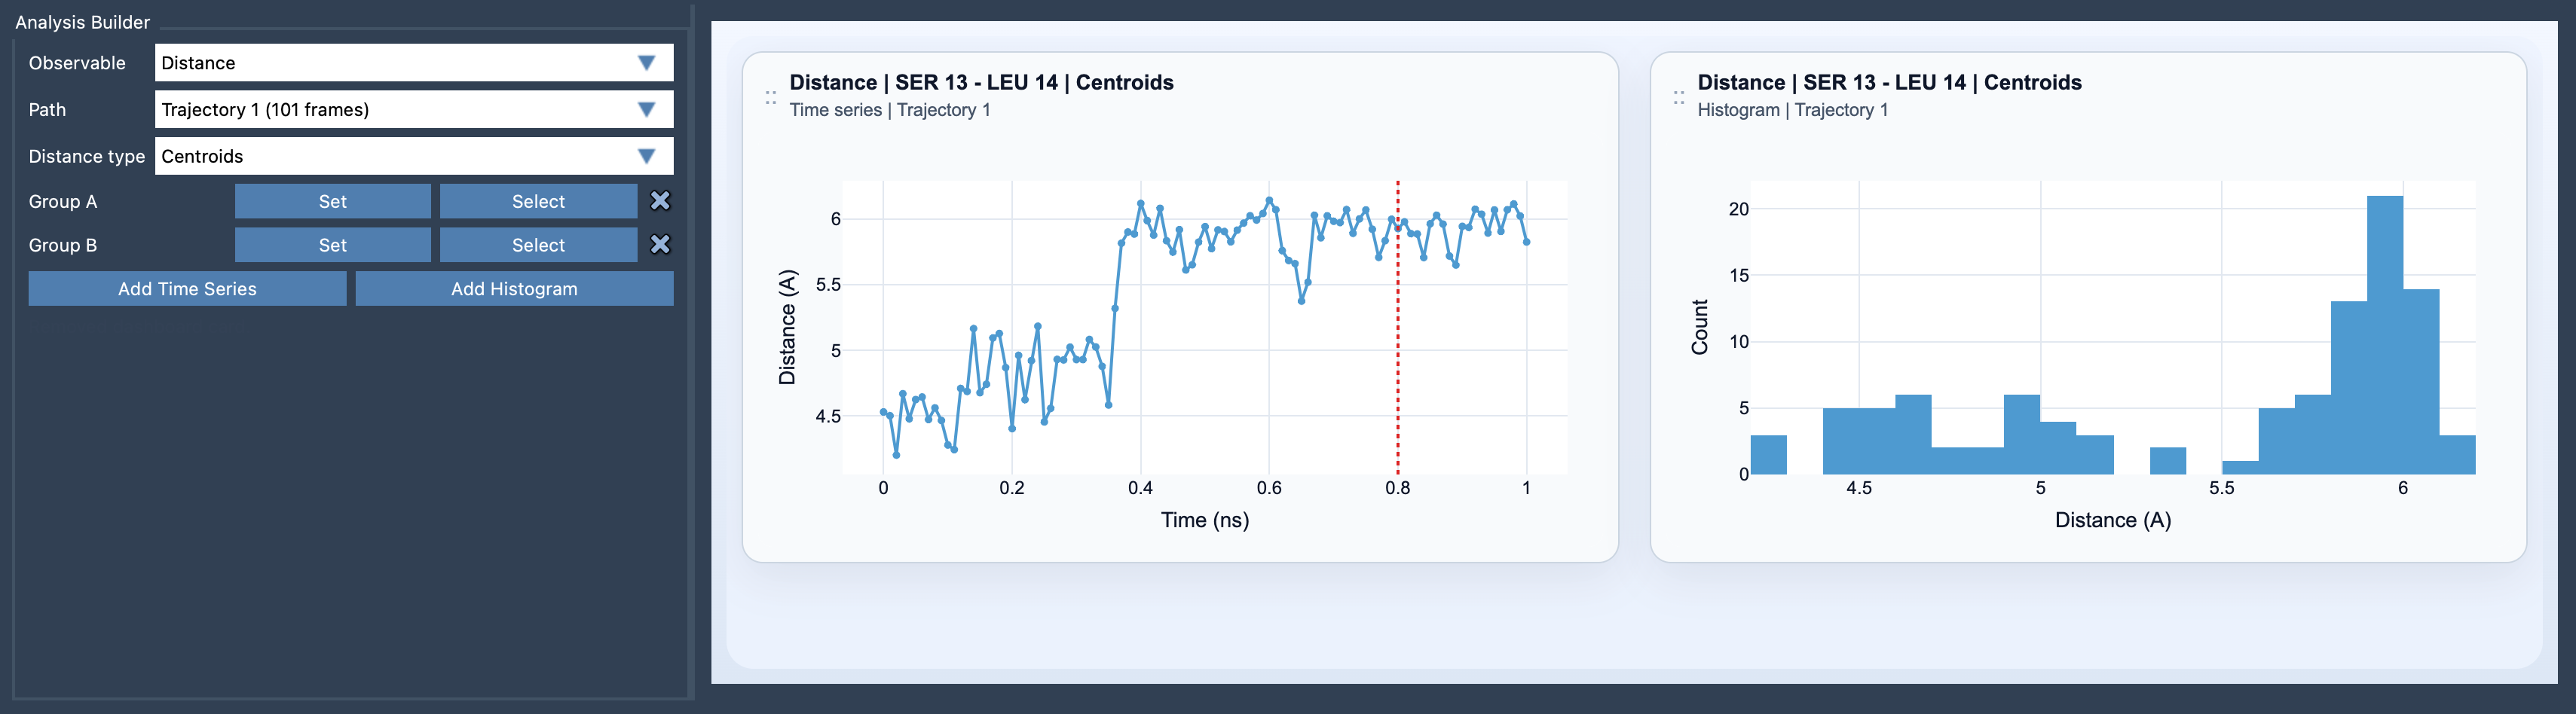
Here’s an example of the Distance tool interface in SAMSON:
Key Practical Tips
To maximize the utility of the Distance tool, consider the following:
- For chemically specific interactions, use small selections (e.g., a few atoms).
- For larger-scale trends, use selections such as residues, domains, or entire chains — this offers a more interpretable, coarse-grained signal.
- Results from the Distance tool make excellent inputs for other Path Analyzer visualizations like Custom Scatter plots, 2D Density Maps, or Energy Landscapes. This integration makes visualization and interpretation seamless.
Final Thoughts
Whether you’re tracking binding events, domain motions, or spatial trends, the Distance tool in SAMSON is designed to help molecular modelers analyze and visualize motion with versatility and ease.
To delve deeper into the Distance tool and its applications, visit the official documentation page here.
Note: SAMSON and all SAMSON Extensions are free for non-commercial use. You can download them from SAMSON Connect.