


When working in molecular modeling, understanding the transitions and energy states of a molecular path is a critical aspect of solving complex molecular problems. Yet, analyzing large-scale simulations to identify low-energy regions, basins, or state transitions can quickly become overwhelming. This is where the Energy Landscape view in SAMSON’s Path Analyzer comes into play, offering a way to visualize and interpret molecular pathways with ease and clarity.
What Is the Energy Landscape?
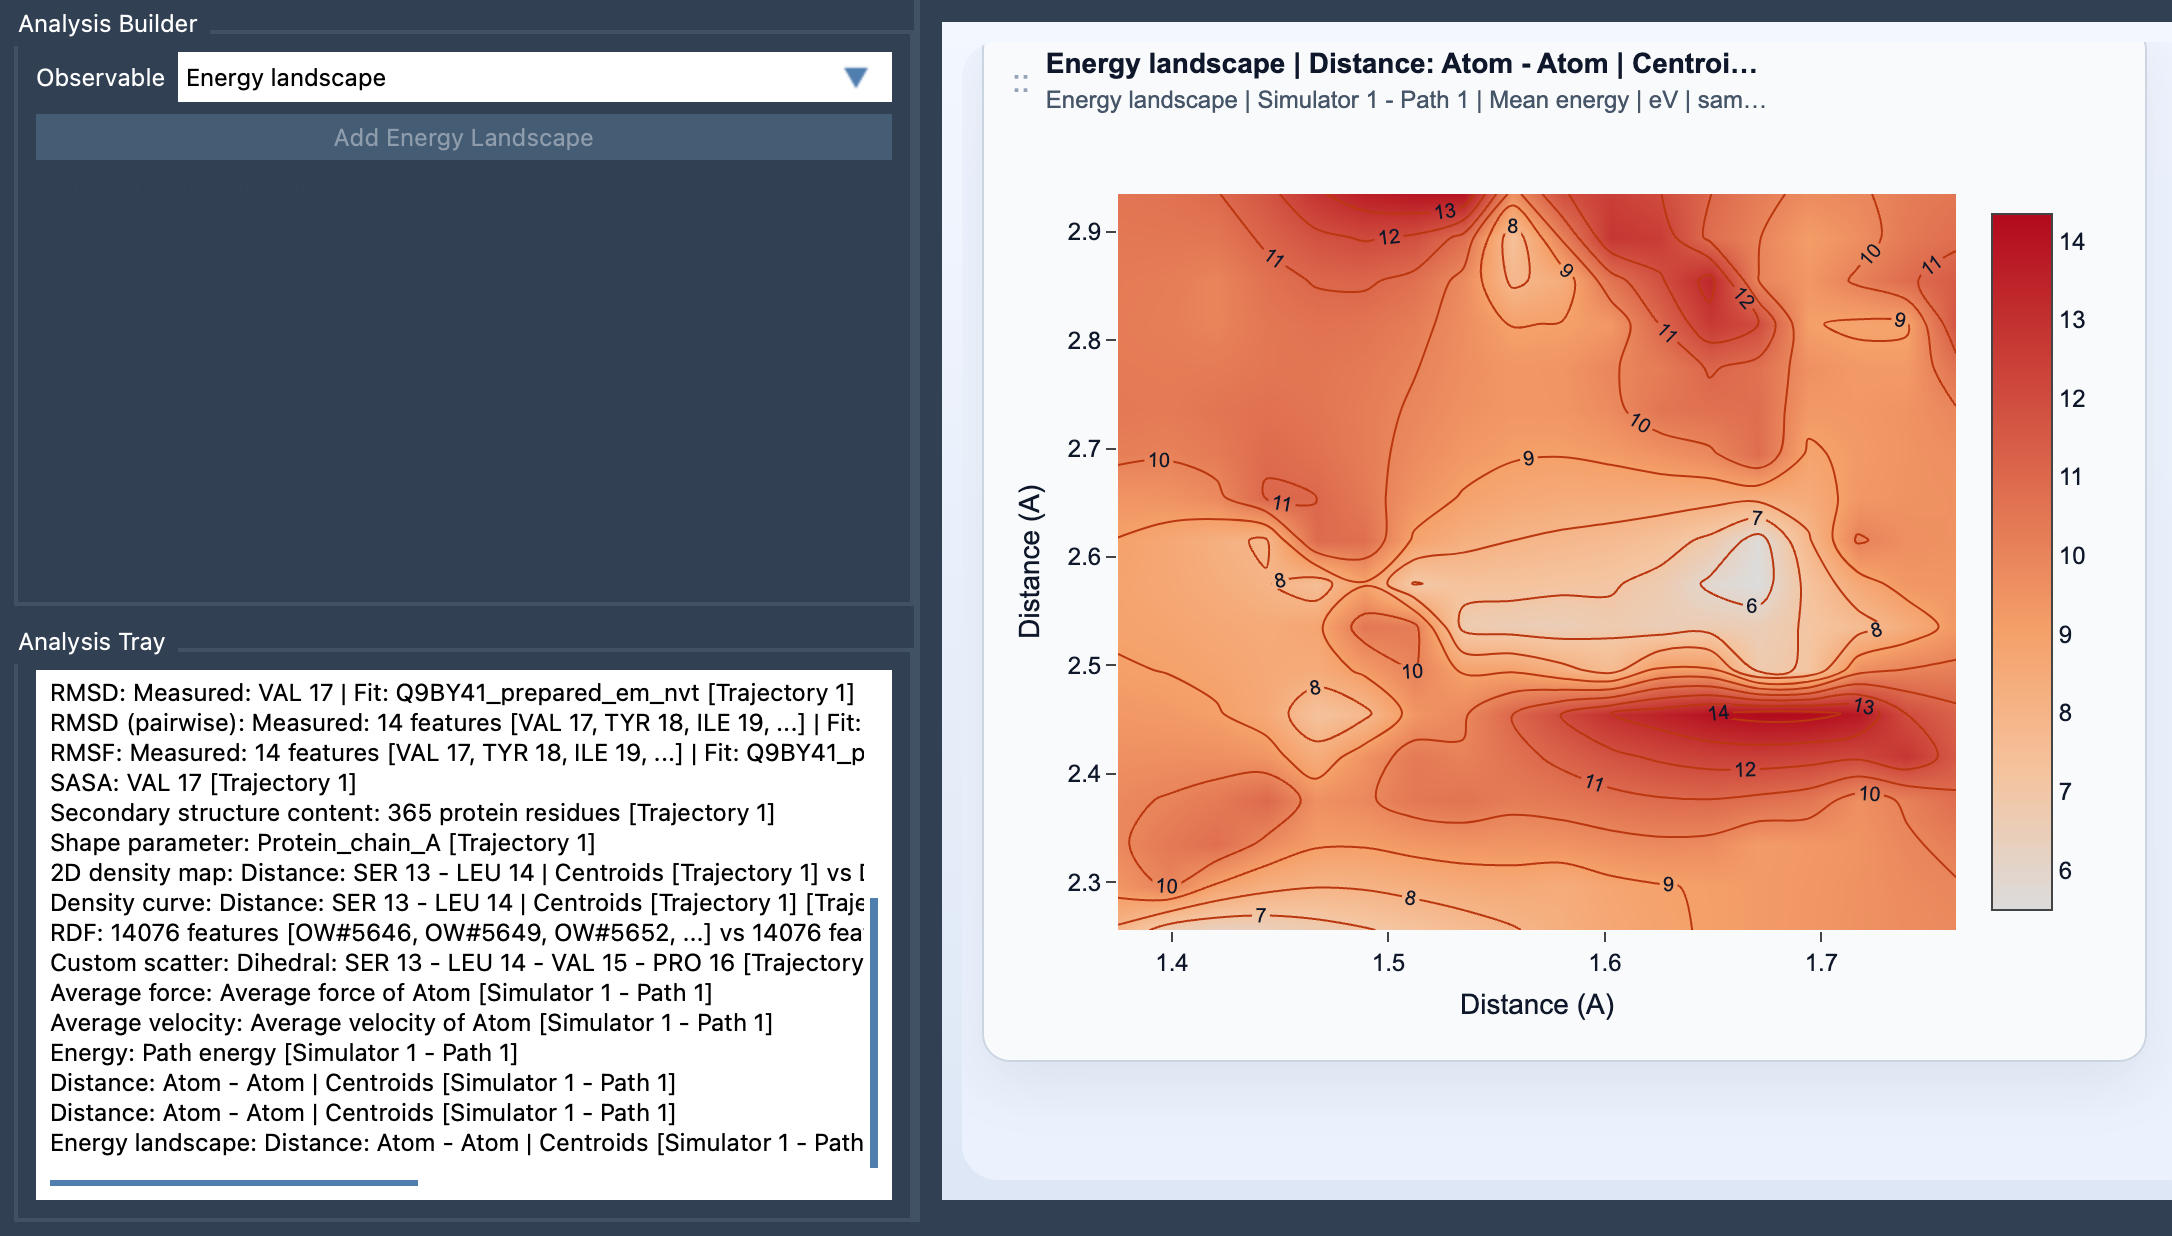
The Energy Landscape analysis is a specialized feature that projects the energy profile of a pathway onto two observables of your choosing. Think of it as a contour map for your molecular path, helping you locate and better understand low-energy regions, densely populated basins, and high-energy transitions. By visualizing these states, researchers can identify structural stability areas, detect possible reaction pathways, and pinpoint critical transitions between states.
Here’s an example of an Energy Landscape visualization:
Why Does This Matter?
Without proper visualization tools, researchers often struggle to correlate energy states with structural changes. Energy Landscapes provide a method to link the energy values of your pathway frames with custom scalar observables (e.g., Distance and RMSD). By doing so, you unlock the ability to:
- Identify the lowest-energy conformations of your system easily.
- Spot basins or local minima where the molecule resides longer (indicating stability).
- Discern transition states for chemical reactions or structural reorganizations.
Getting Started with Energy Landscapes
Setting up an Energy Landscape is straightforward within SAMSON:
- Launch the Path Analyzer.
- Create or reuse two saved scalar analyses in the Analysis Tray. These analyses should summarize some critical properties of your molecular path, such as Distance or RMSD. Make sure both are frame-wise scalar analyses computed on the same path.
- From the Observables menu, choose Energy Landscape.
- Select exactly two scalar observables from the Analysis Tray.
- Click the Add Energy Landscape button to generate your visualization.
Making the Most Out of Your Landscape
Once your Energy Landscape is generated, you can customize it to suit your needs. For example, you may:
- Toggle between
Mean energyorMinimum energyvisualization modes. - Adjust the color scale to highlight specific energy ranges.
- Change contour-line visibility and colors for better clarity.
- Select the preferred energy unit to match your project’s conventions.
This level of control allows you to extract the most relevant information efficiently and makes comparisons more straightforward with complementary tools, such as Custom Scatter or 2D Density Maps.
Tips for Insightful Analysis
For the best results, consider starting with observables that naturally separate the molecular motion. Common choices are Distance and RMSD. This approach allows you to highlight transitions and identify basins more effectively.
Energy Landscapes are particularly valuable in cases where identifying state transitions, reaction pathways, or stable configurations is a priority. They provide intuitive visual cues that help you focus on the most impactful regions of your molecular path.
Learn More
If you want to dive deeper into creating and working with Energy Landscapes, check out the full documentation page: Energy Landscape Documentation.
Note: SAMSON and all SAMSON Extensions are free for non-commercial use. Download SAMSON at SAMSON Connect.