



For molecular modelers and researchers working with protein dynamics, tracking backbone-state changes over time can be a challenging yet crucial task. Whether you’re diving into protein folding studies, monitoring domain transitions, or studying unstructured regions, efficiently summarizing such structural data is key to unlocking new insights. In SAMSON, the Secondary Structure Content analysis tool offers a straightforward, visual solution to this problem.
Why Track Secondary Structure Content?
Proteins exhibit complex structural transitions between alpha helices (α), beta sheets (β), and unstructured regions. These changes significantly influence the protein’s functionality and interactions. Understanding how much of a protein selection is in these structural states at each frame of your trajectory provides a high-level summary that can help identify key areas of interest and time points for in-depth study.
For instance, if you’re studying an enzyme undergoing significant conformational changes, such as a shift from an alpha-helical domain to a beta-sheet-rich state, the Secondary Structure Content tool provides you with a clear, time-series visualization of these transitions, saving you time and effort.
Getting Started
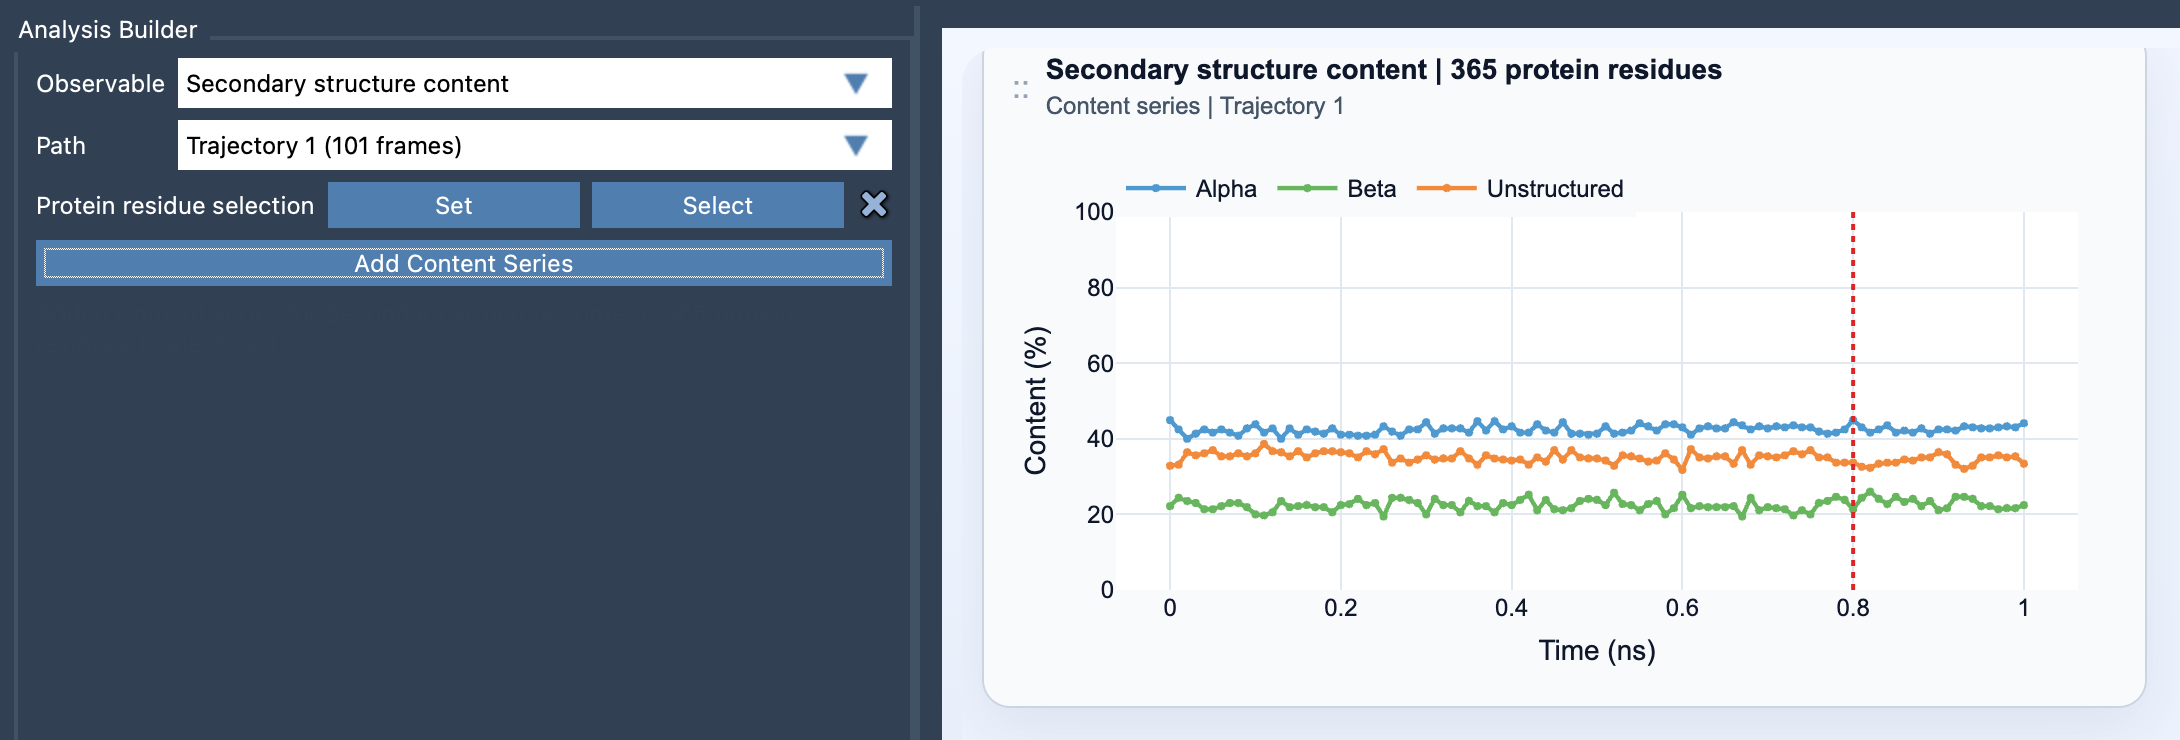
Adding the Secondary Structure Content plot to your SAMSON Path Analyzer is simple:
- Open the Path Analyzer in SAMSON.
- Select Secondary structure content in the Observable option.
- Define a Path, which corresponds to your trajectory of interest.
- Provide a Protein residue selection, i.e., the region of the protein you want to focus on.
- Click on Add Content Series to generate the time-dependent plot.
The result? An intuitive, multi-series time plot that visually summarizes the percentages of α helices, β sheets, and unstructured regions in your selection across the frames of your trajectory. This visualization is particularly helpful when paired with additional backbone analysis tools, like the Ramachandran analysis, for residue-level details.
Tips for Insightful Analyses
Here are some strategies to make the most of the tool:
- Broad selections for an overview: If you want a global protein-wide summary, use the tool with a broad residue selection. This allows you to identify general trends and overall structural alterations.
- Focused selections for specific insights: To dissect individual regions, domains, or loop-rich areas, focus your residue selections. For example, isolating a helix bundle or a fluctuating loop can offer detailed insights into localized behaviors.
- Pair analyses: Use the Secondary Structure Content tool alongside other visualization options in SAMSON, like the Ramachandran plot, for a more complete understanding of how structural elements evolve over time.
How It Works
The tool calculates the percentage of residues in each structural state at every frame of your trajectory, using the following equations:
These calculations report, for example, the percentage of alpha helices as: %α(t) = 100 × Nα(t) / Nres, where Nα(t) represents the number of residues in the alpha-helical state at frame t, and Nres is the total amount of selected protein residues. Similar equations apply for β sheets and unstructured regions.
Learn More
The Secondary Structure Content tool makes it easy to turn complex protein trajectories into clear and actionable insights. Whether you’re interested in broad conformational changes or localized dynamics, this visualization provides a robust starting point for your work.
Ready to explore protein structure dynamics in action? Check out the full documentation here to learn more.
SAMSON and all SAMSON Extensions are free for non-commercial use. Get SAMSON today at https://www.samson-connect.net.