



Protein modeling is a complex field, and ensuring a protein model is accurate and free of structural issues can be a significant challenge. One critical step in this process is validating the backbone conformations of amino acid residues. The Interactive Ramachandran Plot in SAMSON offers a user-friendly solution to this problem, enabling molecular modelers to explore, validate, and edit protein structures with ease.
Why the Ramachandran Plot Matters
At the core of any protein structure lies its backbone, determined by the dihedral angles φ (phi) and ψ (psi). The Ramachandran Plot maps these angles, illustrating energetically favorable and unfavorable regions for amino acid residues based on steric and energetic constraints. This tool is essential for identifying strained residues which may indicate modeling inaccuracies or regions needing refinement.
Getting Started with the Interactive Ramachandran Plot
With SAMSON, incorporating the Interactive Ramachandran Plot into your workflow is straightforward. Follow these initial steps:
- Log into SAMSON Connect and visit the Interactive Ramachandran Plot extension page.
- Add the extension to your workspace and restart SAMSON.
- Load a protein file (e.g., PDB ID
1YRF) to begin using the tool immediately.
Visualizing and Filtering Protein Residues
Once you have opened the Ramachandran Plot app via Home > Apps > Biology > Ramachandran Plot, generate the plot by clicking the Update button. You’ll see a detailed visualization where:
- Yellow areas represent energetically favorable regions.
- White areas indicate unfavorable conformations.
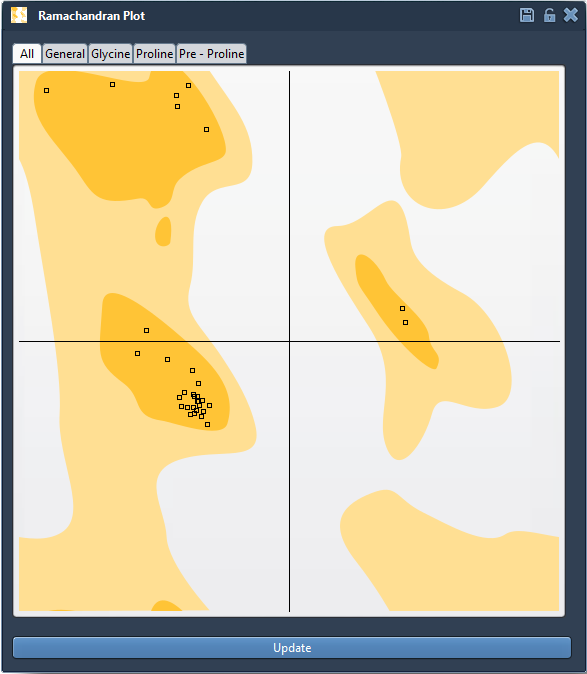
The tool lets you filter residues by categories such as General, Glycine, Proline, and Pre-proline, making it easy to focus on specific groups of residues. This functionality is invaluable for analyzing unique backbone characteristics.
Exploring Individual Residues
The Interactive Ramachandran Plot isn’t just for visualizing residues—it helps you dive into conformational details. Clicking on a dot corresponding to a residue (e.g., Proline) selects it, both in the plot and in the 3D viewport. This instant feedback allows you to identify residues located in unfavorable regions and directly address modeling issues.
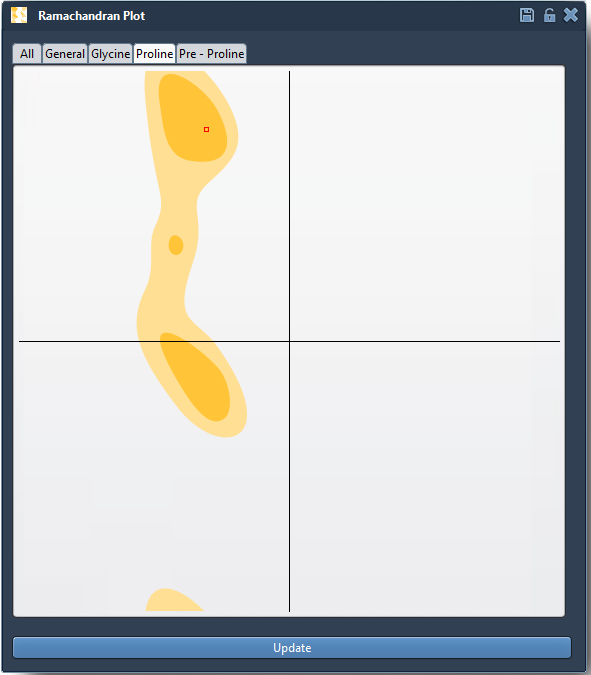
Additionally, the status bar updates to display the exact φ and ψ values for the selected residue:

Editing Protein Conformations
One of the standout features of the Interactive Ramachandran Plot is the ability to modify protein conformations interactively:
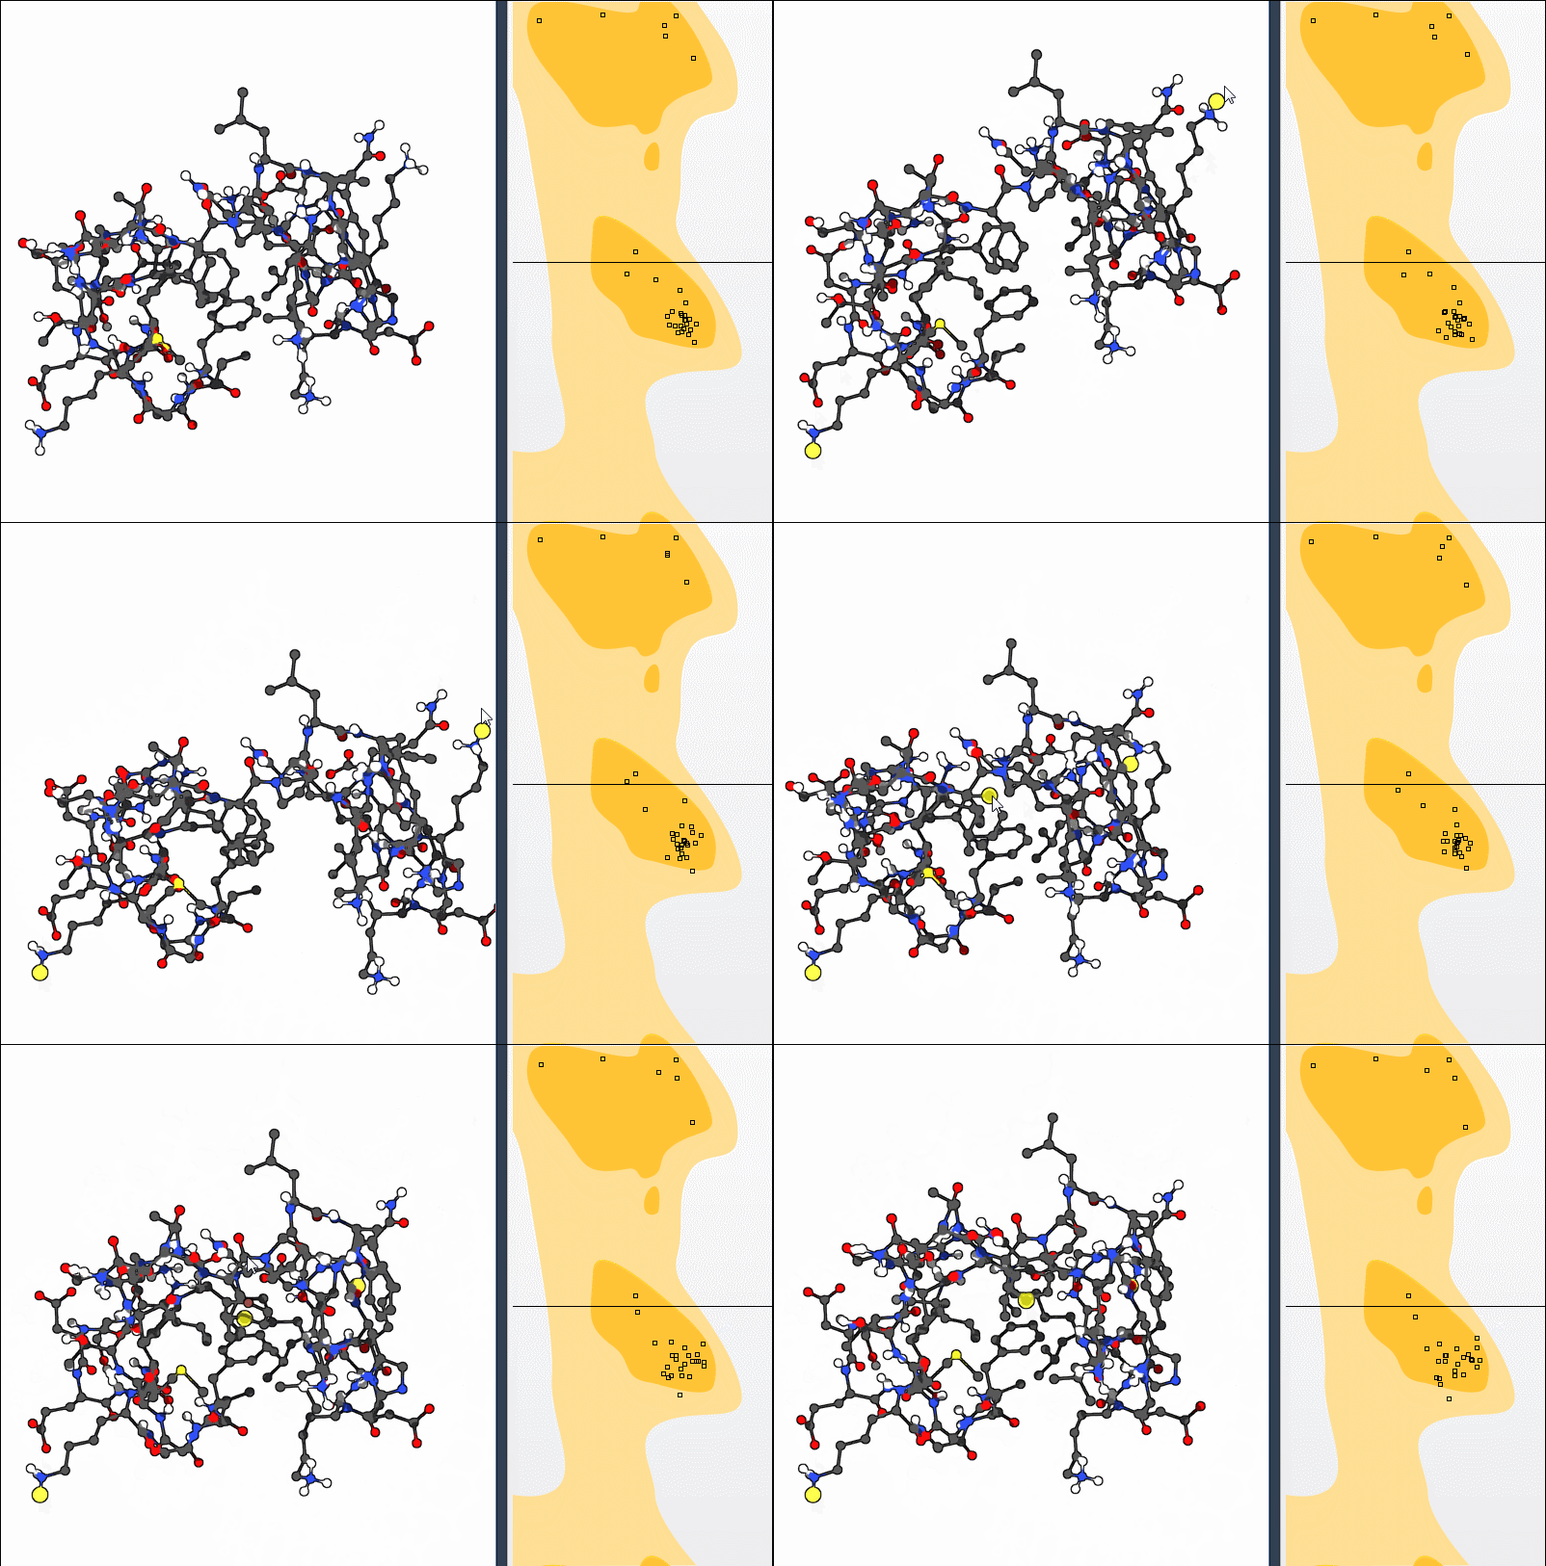
- Drag points on the plot to adjust dihedral angles in real time, with the protein structure updating instantly in the 3D viewport. Use Ctrl/Cmd + Z to undo changes.
- Alternatively, select the Twister editor to manipulate the protein backbone directly in 3D space, observing live updates in the plot:
Integrating Ramachandran Analysis into Workflows
The Interactive Ramachandran Plot not only streamlines protein validation but also serves as a critical tool in many molecular modeling workflows. It aids in:
- Detecting strained residues before running molecular dynamics simulations.
- Refining homology models by adjusting outlier conformations.
- Analyzing flexibility in active or binding sites for functional studies.
Exploring these features can significantly enhance your productivity and provide deeper insights into your protein structures.
Learn More
To dive deeper into this topic and master the Interactive Ramachandran Plot in SAMSON, visit the full documentation here.
SAMSON and all SAMSON Extensions are free for non-commercial use. You can get SAMSON at https://www.samson-connect.net.