



When working on molecular modeling, understanding the spatial organization of atoms is fundamental. If you’ve ever wondered how to analyze the local packing of molecules, solvation structures, or interaction distances between atomic groups, the Radial Distribution Function (RDF) can provide the answers you need.
The RDF analysis computes how atoms or molecules are distributed as a function of distance. It is especially useful for addressing questions such as: “What is the local density around my molecule of interest?” or “How do two specific groups interact in my system?” The Path Analyzer extension in SAMSON facilitates RDF calculations in just a few steps, simplifying workflows for complex systems.
Getting Started with RDF in SAMSON
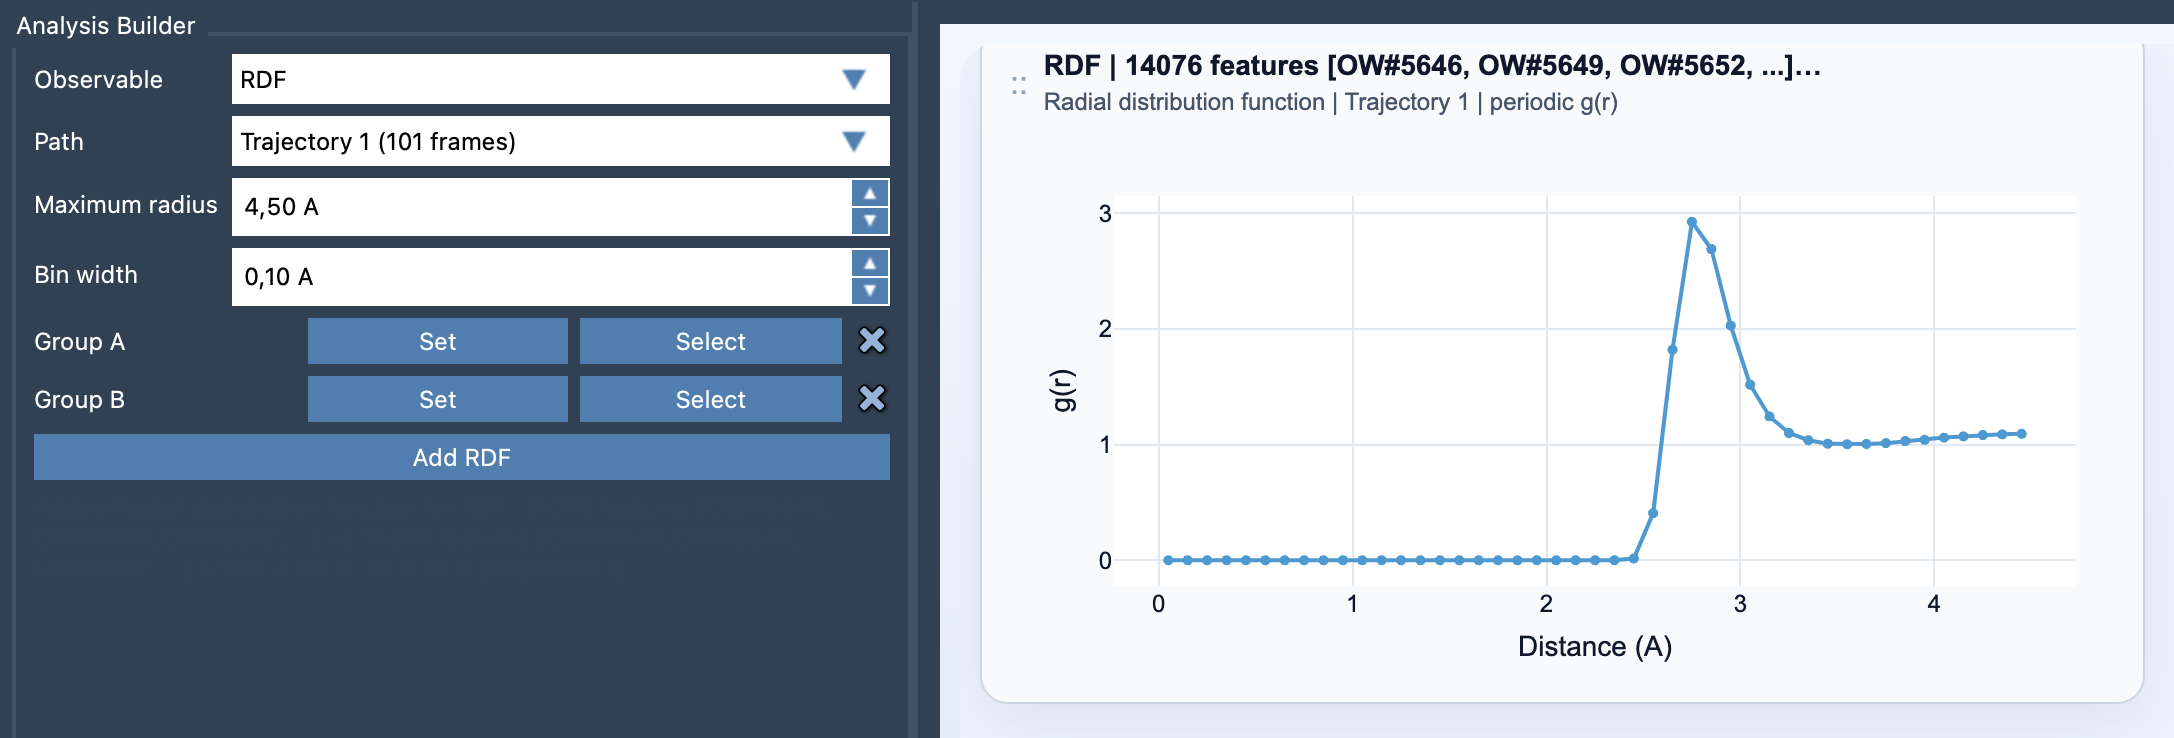
To get started with RDF analysis in SAMSON, head over to the Path Analyzer tool and follow these simple steps:
- Select “RDF” in the Observable list.
- Define two groups of atoms. These will be referred to as Group A and Group B, and could represent, for example, solute and solvent molecules.
- Set parameters like the Maximum radius (defining how far out the distribution is sampled) and the Bin width (controlling the resolution).
- Choose the desired Path and click “Add RDF” to generate the curve.
The result is a one-dimensional curve showing density as a function of distance. This visualization immediately highlights key interaction distances or structural organization in the system.
Key Insights with RDF Analysis
Here’s how the RDF works:
- The RDF essentially counts how many pairs of atoms are at a given distance r. When periodic cell information is available, it can normalize this count against what is expected in an ideal gas, giving a properly scaled g(r).
- If periodic normalization isn’t available, RDF curves are presented in arbitrary units, falling back to an unnormalized approach.
The generated RDF plots can reveal a great deal about your molecular system. For instance:
- Peaks in the curve indicate preferred distances between groups.
- The shape and intensity of the plot’s peaks can provide solvation structure information or indicate characteristic packing distances in condensed phases.
Pro Tips for Effective RDF Analysis
Tip
- Use a sufficiently fine bin width to resolve structural peaks without making the curves too noisy.
- Define chemically meaningful groups for analysis, such as solute-solvent, ligand-protein pocket, or specific residue interactions.
Conclusion
RDF analysis in SAMSON empowers users to dissect molecular interactions and spatial arrangements in their systems with ease. Whether you’re working on solvation, local packing, or interaction profiling, the RDF tool in the Path Analyzer is a reliable ally.
To dive deeper into RDF and its implementation in SAMSON, visit the official documentation page.
Note: SAMSON and all SAMSON Extensions are free for non-commercial use. Get SAMSON today at https://www.samson-connect.net.