



Protein modelers often face the challenge of strained or unfavorable conformations when working with molecular structures. This can disrupt simulations and bring inaccuracies to predictive workflows. Enter the Ramachandran Plot: a tool that visualizes backbone dihedral angles (φ and ψ) to help detect and refine protein conformations effectively.
Why Use a Ramachandran Plot?
The Ramachandran Plot provides insights into the energetically allowed regions for backbone angles in amino acids. By categorizing residues into favored (yellow regions) or disallowed (white regions), the plot reveals areas where strain or steric clashes could undermine protein modeling workflows.
For molecular modelers, this visual feedback is critical for pinpointing strained residues, validating structures, and refining homology models. But the true power lies in coupling the visualization with interactivity. With SAMSON’s Interactive Ramachandran Plot Extension, you can do more than assess – you can edit conformations directly.
Getting Started with the Interactive Ramachandran Plot
The Interactive Ramachandran Plot Extension in SAMSON transforms static visual data into dynamic workflows. Here’s how to start:
- Ensure you’re logged in to SAMSON Connect.
- Add the Interactive Ramachandran Plot Extension to your workspace via its extension page.
- Restart SAMSON and open a protein structure of interest.
For example, you can fetch a structure like PDB ID 1YRF using the Home > Fetch tool in SAMSON.
How to Use the Ramachandran Plot App
Visualizing the Plot
Access the Ramachandran Plot App through Home > Apps > Biology > Ramachandran plot. Once the app is open, click Update to generate a plot. You will see:
- Yellow regions: Energetically favorable conformations.
- White regions: Unfavorable conformations.
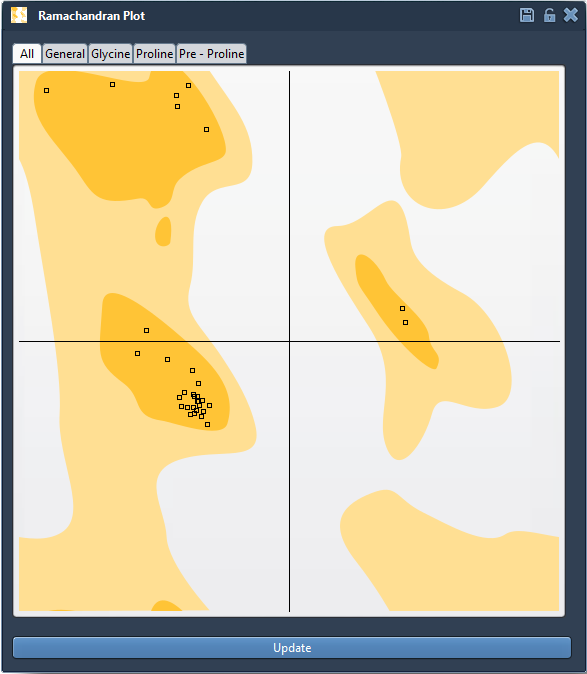
Filtering and Inspecting Residues
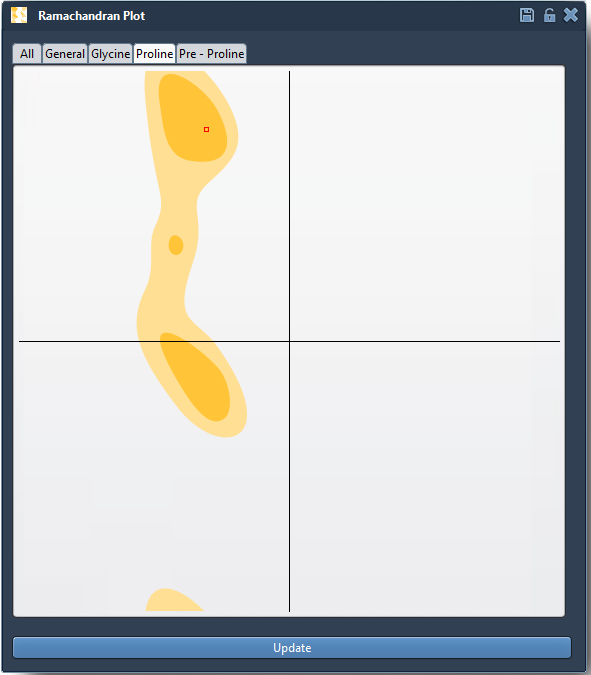
The app allows you to filter residues by their type, such as General, Glycine, Proline, or Pre-proline (residues preceding proline in the amino acid chain). Click a dot in the plot to select a residue. SAMSON will highlight it in the viewport and display its φ and ψ angles in the status bar:

Interactive Editing: Refining Residues Live
What sets the Interactive Ramachandran Plot apart is its ability to modify protein conformations dynamically:
Option 1: Drag Points
- Manually drag a point in the plot to adjust φ and ψ angles in real-time.
- The 3D structure updates instantly in the viewport, reflecting your edits.
- If necessary, undo with Ctrl/Cmd + Z.
Option 2: Twister Editor
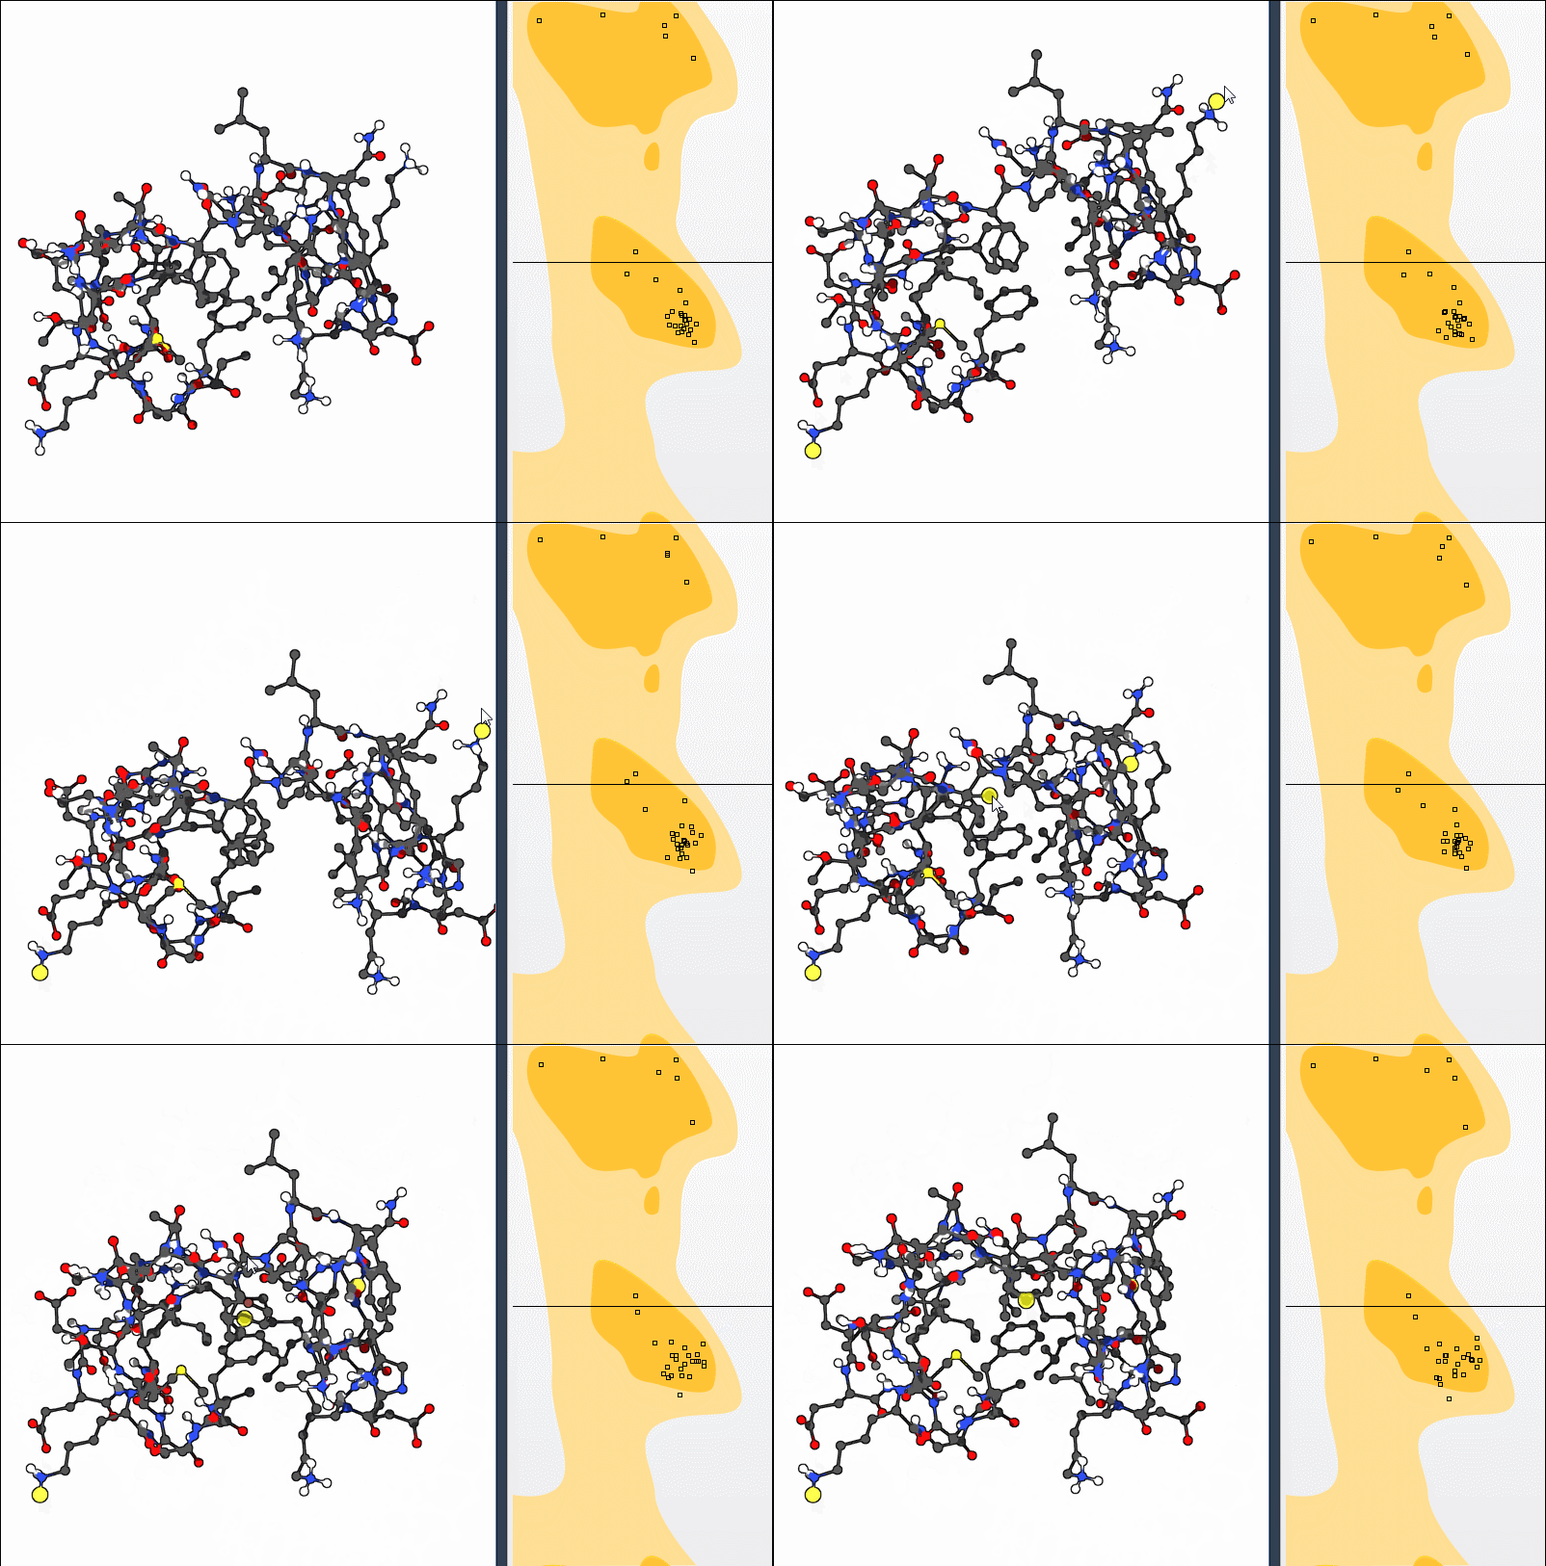
If you want even more control, the Twister Editor allows for 3D manipulations:
- Select the Twister Editor from the viewport’s left-hand menu.
- Twist your protein to observe changes in the plot dynamically:
Applications in Modeling
Interactive Ramachandran plots streamline several critical protein-modeling tasks:
- Validation: Detect strained residues before simulations.
- Refinement: Correct outliers in homology models.
- Flexibility Analysis: Explore conformational dynamics in binding or active sites.
To dive deeper into this powerful tool, visit the official documentation at https://documentation.samson-connect.net/tutorials/ramachandran/ramachandran-plot/.
Note: SAMSON and all SAMSON Extensions are free for non-commercial use. Get SAMSON at https://www.samson-connect.net.