



In molecular modeling, ensuring that protein structures are energetically sound is a key step before simulations or further design processes. Strained residues or unlikely conformations can throw off your models and simulations, wasting precious time. This is where the Interactive Ramachandran Plot in SAMSON becomes an essential tool, offering an intuitive way to inspect and edit protein backbone conformations in real time.
What is a Ramachandran Plot?
A Ramachandran Plot visualizes the dihedral angles (φ and ψ) of the protein backbone and maps these against regions of favored and disallowed conformations. Energetically favorable regions are typically clustered in well-defined areas of the plot, helping researchers identify residues that might be strained or non-physical.
Using the Interactive Ramachandran Plot in SAMSON, you can connect the insights from this visualization with actionable steps to refine your protein model. Let’s explore some key functionalities.
How to Validate and Edit Conformations
Real-Time Feedback on Residues
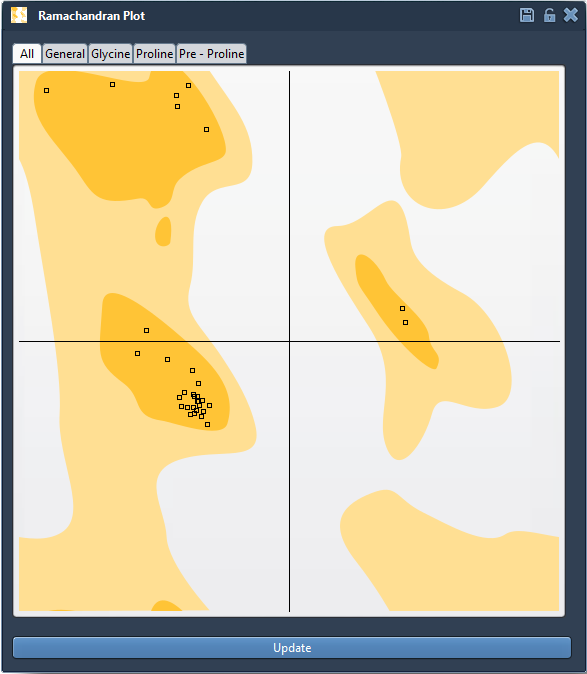
Once you load your protein structure and initialize the plot in SAMSON, residues are represented as points on the plot:
- Yellow areas: Energetically favorable regions.
- White areas: Unfavorable conformations.
Clicking on a point highlights the corresponding residue in the protein’s 3D structure, helping you immediately locate problematic regions. The status bar displays dihedral angles (φ and ψ) for precise values, making it easy to understand the source of strain in the structure.
Interactive Refinement
Editing residues is simple and intuitive:
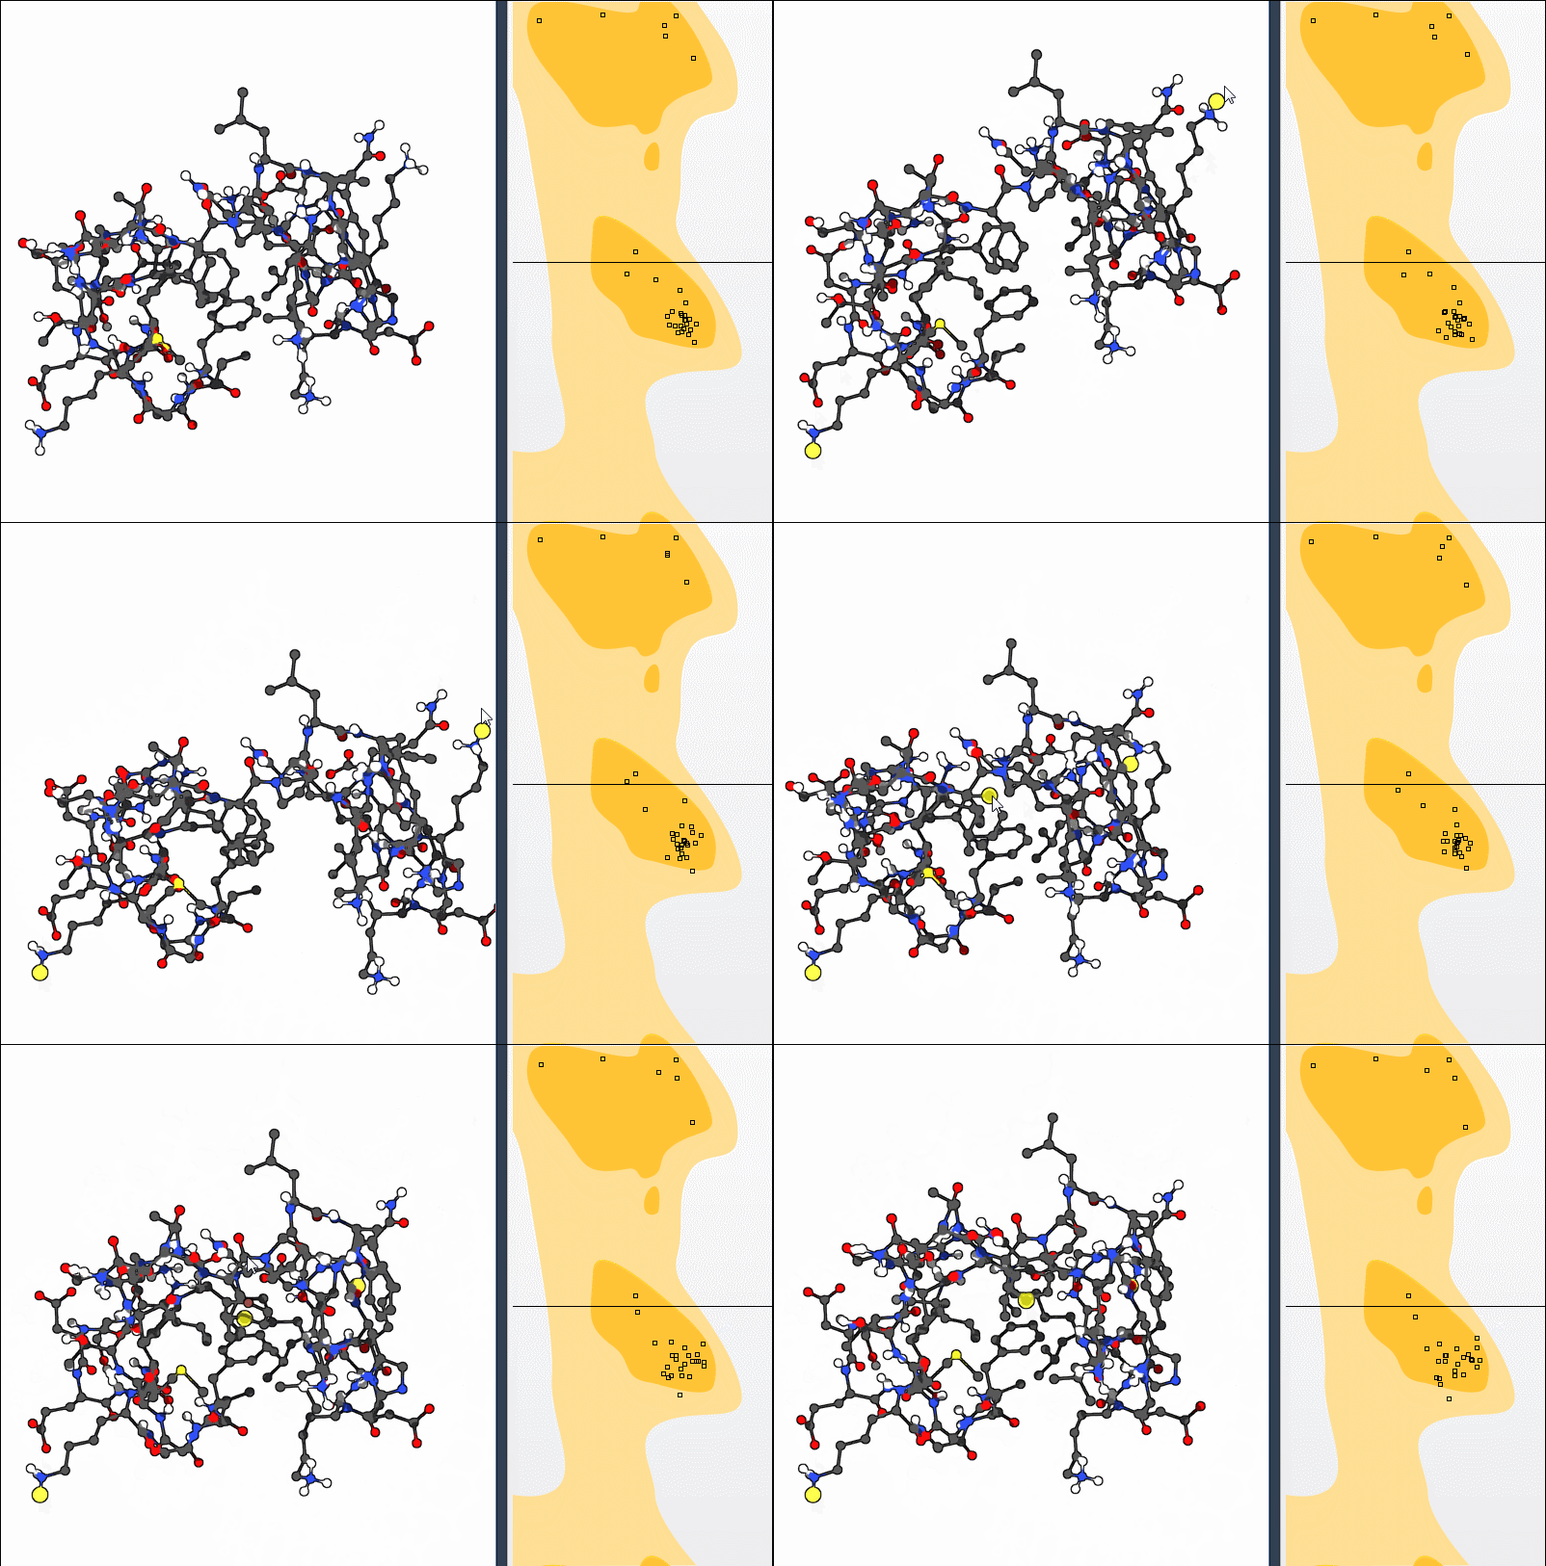
- Drag points: You can directly drag any point on the plot to instantly update the dihedral angles for that residue. The change is reflected in real-time on the structure, allowing you to refine the conformation while keeping all residues in energetically favored regions. The undo functionality (Ctrl/Cmd + Z) ensures you can easily revert changes if needed.
- Twister Editor: Alternatively, use the Twister Editor to manipulate the protein backbone in 3D. Adjustments made here will simultaneously update the plot, making it a great way to experiment with global and local conformational changes.
Applications in Protein Modeling
This tool proves to be indispensable in several areas of molecular modeling:
- Detect strained residues: Avoid simulation bottlenecks by identifying and fixing unfavorable regions in your structure before running any computations.
- Refine homology models: Bring poorly folded or strained residues into alignment with known dihedral angle preferences.
- Analyze flexibility: Understand the dynamics and flexibility of key residues, particularly around active or binding sites.
Next Steps
The Interactive Ramachandran Plot in SAMSON is a robust and user-friendly solution for validating and refining protein conformations. Whether you are preparing your structure for docking, simulations, or design workflows, this tool will save you time and help ensure the accuracy of your models. To learn more about using the Interactive Ramachandran Plot, visit the official documentation here.
Note: SAMSON and all SAMSON Extensions are free for non-commercial use. Download SAMSON at https://www.samson-connect.net.