



For molecular modelers, analyzing relationships between variables can be a critical part of gaining scientific insights about molecular systems. Whether you’re investigating correlations between energy and distance or uncovering clusters in complex data, visualizing these connections is essential. With SAMSON’s Custom Scatter feature, comparing two saved scalar analyses has never been more straightforward.
Why Use Custom Scatter?
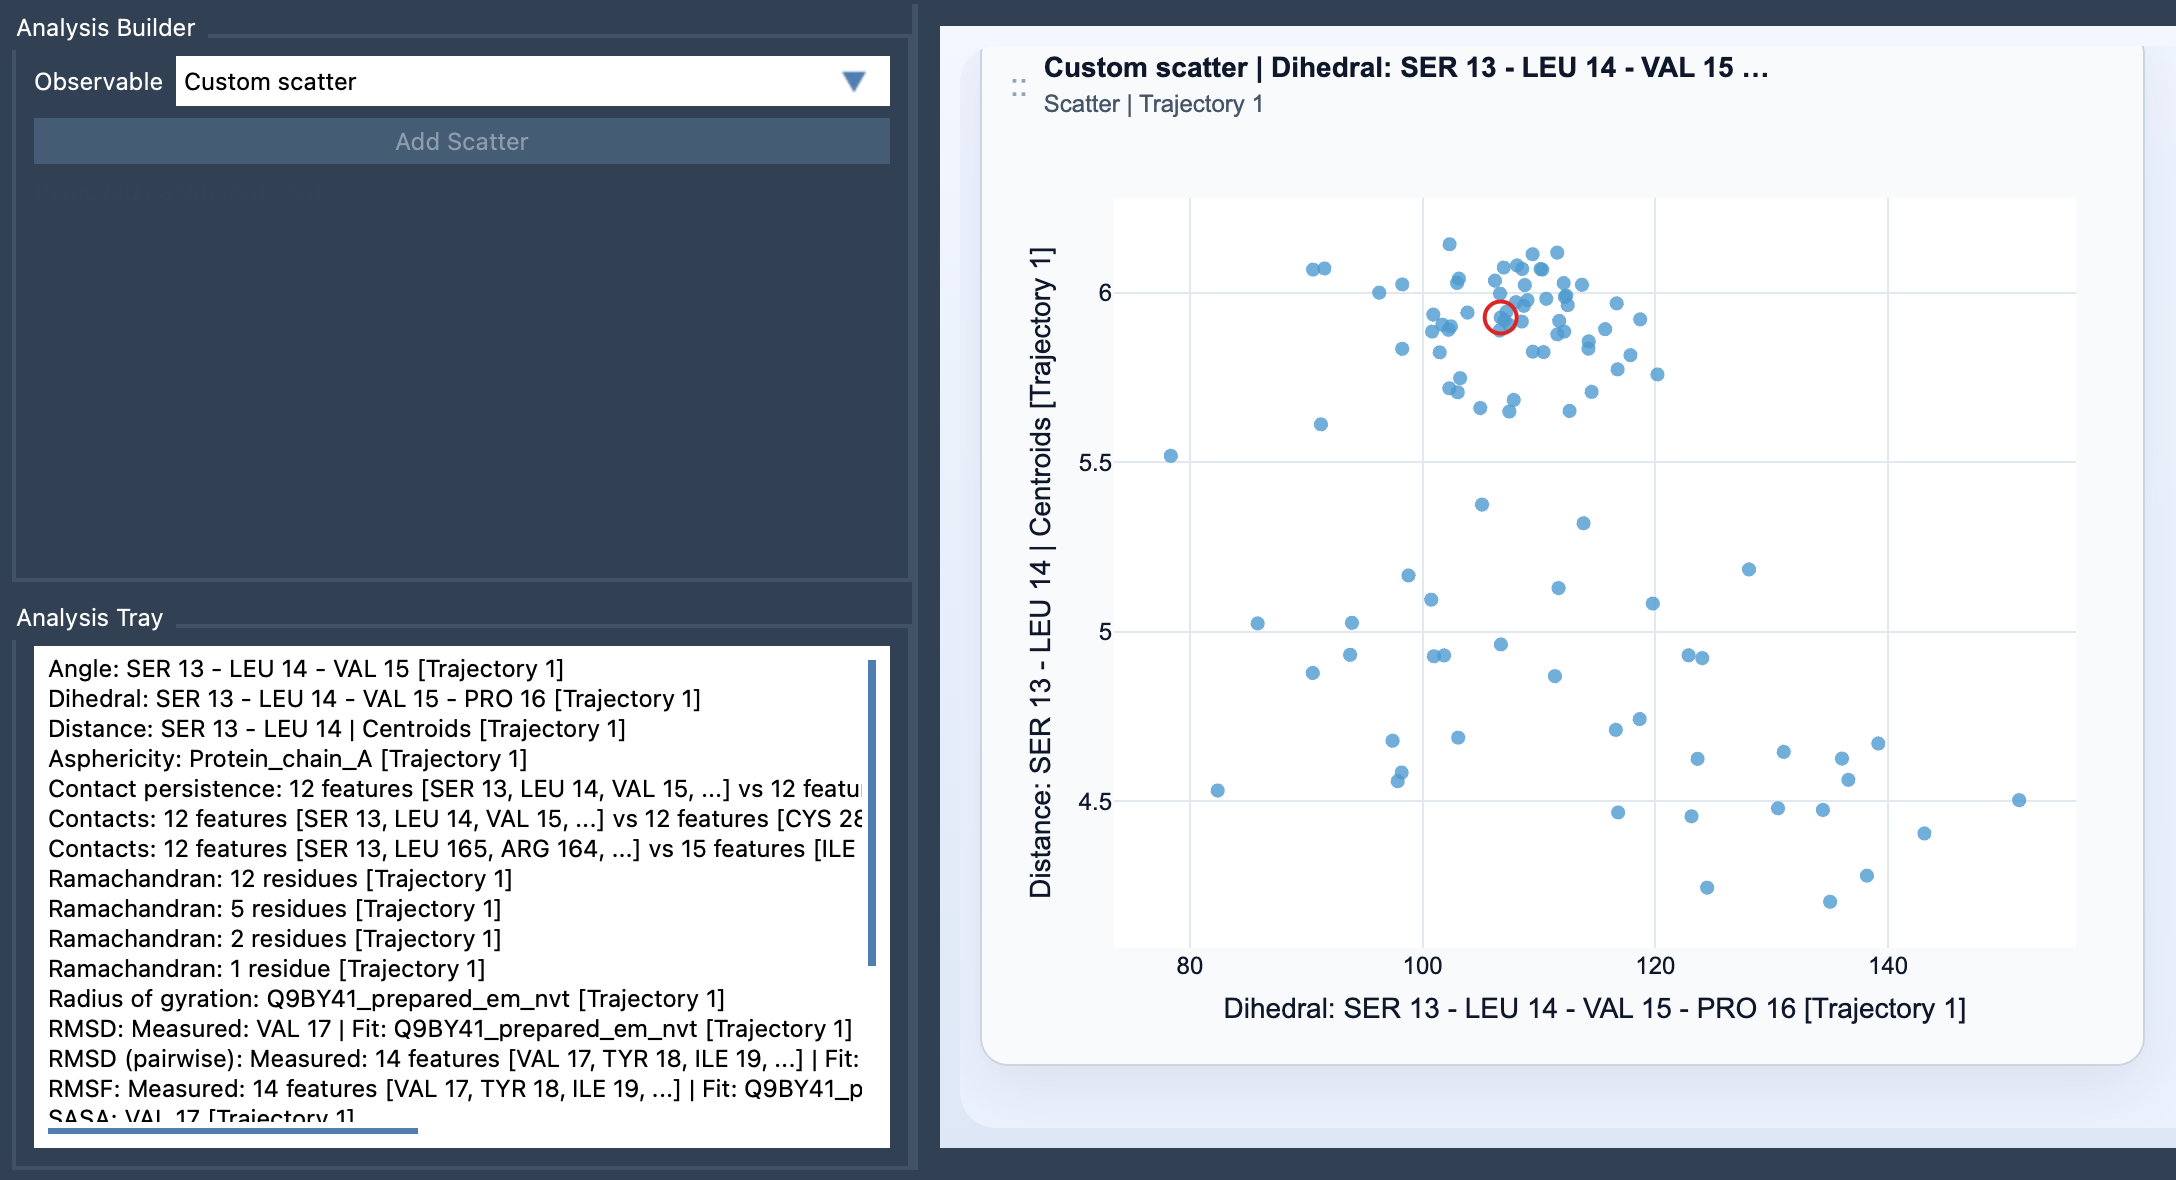
The Custom Scatter feature allows users to directly compare two scalar analyses. By plotting one variable against another in a scatter plot, users can uncover valuable patterns such as correlations, anticorrelations, clusters, or even transition pathways. This makes it an excellent tool for addressing important scientific questions and for understanding observable spaces more intuitively.
For example, imagine you’re examining how the radius of gyration (RMSD) relates to energy changes. Or perhaps you want to identify clusters based on solvent-accessible surface area (SASA) and distance. Custom scatter plots provide a clear visual method to address these exact types of queries.
Getting Started with Custom Scatter
Here is a simple step-by-step guide to create a custom scatter plot in SAMSON:
- Open the Path Analyzer tool in SAMSON.
- Have two scalar analyses ready, saved in the Analysis Tray.
- Select Custom scatter as the observable within the Path Analyzer UI.
- Choose the two scalar analyses from your tray (note that exactly two selections are required).
- Click the Add Scatter button to generate your scatter plot.
Key Features of Custom Scatter
The flexibility of Custom Scatter extends to its inputs and interactions:
- Derived Analysis: Unlike direct atom selections, this feature works from saved scalar analyses in the Analysis Tray.
- Frame-Linking: If the analyses come from the same path and are frame-linked, the scatter plot can remain connected to the current frame. Additionally, clicking on a specific point will move the path to the corresponding frame.
Applications and Insights
Custom scatter plots are not just about visualization; they are opportunities for deeper discovery. Once you identify interesting clusters or trends in your data, these can serve as the foundation for further analyses. For example:
- Create a 2D density map to study population distributions.
- Explore energy topographies with an Energy Landscape.
By starting with a scatter plot, you build an intuitive understanding that leads to more sophisticated interpretations of molecular behavior.
Practical Tip for Modelers
Always select scalar analyses that align with clear scientific objectives. For instance, analyzing Distance vs Energy or SASA vs Distance often leads to insights into conformational changes or structural stability. With the right pairings, your scatter analysis can yield powerful revelations about your system.
Learn More
For more details on how to use the Custom Scatter feature and other analytical tools in SAMSON, visit the full documentation page: Custom Scatter.
SAMSON and all SAMSON Extensions are free for non-commercial use. You can download SAMSON at https://www.samson-connect.net.