



Molecular modelers often face the challenge of understanding and tracking the dynamical behavior of molecular systems over time. For example, how can you quickly spot bursts of motion or identify consistently quiet regions in your molecular simulations? This is where the Average Velocity analysis provided by SAMSON’s Path Analyzer can greatly help.
The Average Velocity tool calculates the mean velocity magnitude of a group of selected atoms as they move along a defined path. It’s particularly valuable for identifying changes in dynamics within molecular trajectories, making it easier to explore motion patterns that might not be obvious upon visual inspection alone.
Why Use Average Velocity?
Average velocity is an essential analysis tool for molecular dynamists. Imagine you are simulating the motion of a protein or molecule under specific conditions. Some regions might fluctuate intensely, while others remain nearly stationary. Understanding these fluctuations is critical to linking atomic motion with the driving forces behind it.
This tool enables you to:
- Monitor and quantify dynamic regions in molecular simulations.
- Detect bursts of motion and periods of quiescence with a glance.
- Evaluate velocity distributions to identify patterns or anomalies in atomic movement.
How to Add an Average Velocity Plot
Adding an Average Velocity plot in SAMSON is straightforward:
- Open the Path Analyzer in SAMSON.
- Select Average velocity in the Observable menu.
- Choose the Path that contains your data.
- Define your Group of interest (the atoms you want to analyze).
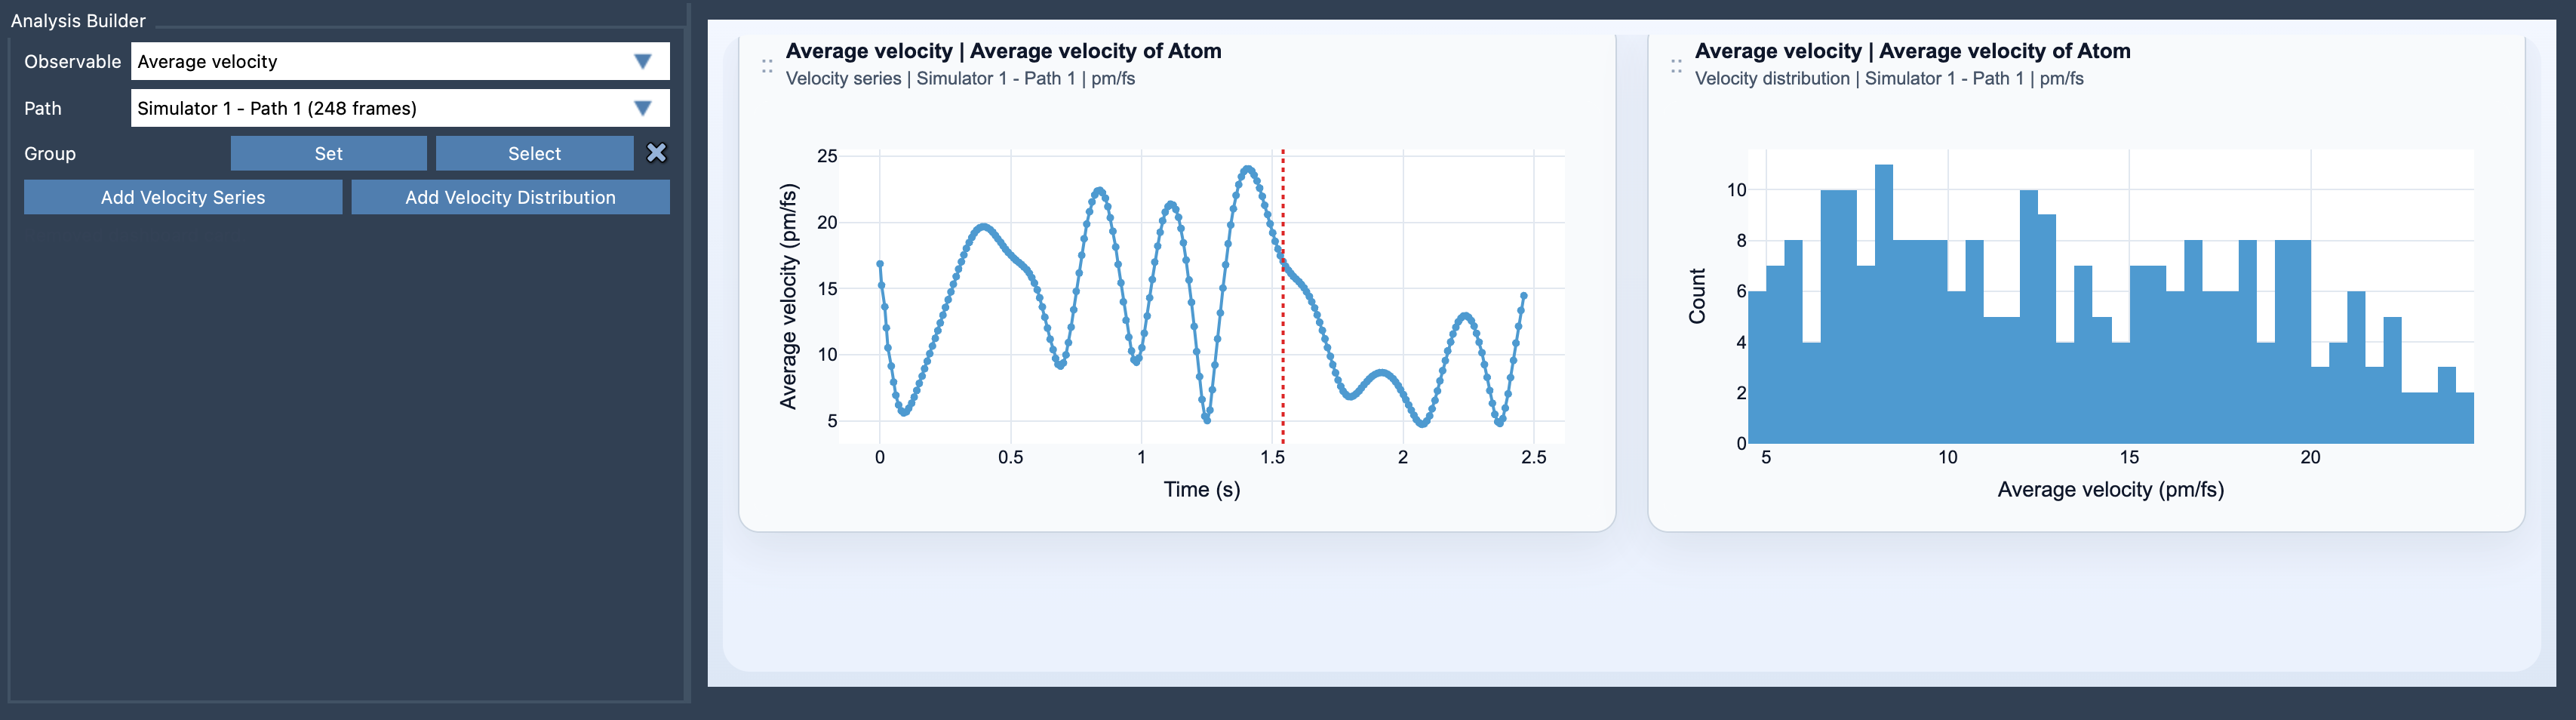
- Click Add Velocity Series or Add Velocity Distribution.
And that’s it! You’ll have an insightful plot visualizing how the selected group’s mean velocity varies along the path.
Insights From Views: Velocity Series vs. Velocity Distribution
The tool provides two complementary views to analyze average velocity:
- Velocity Series: This view tracks the mean velocity magnitude across the path, frame by frame. It’s ideal for visualizing overall changes and locating significant motion bursts over time.
- Velocity Distribution: This view shows the distribution of the sampled velocities, helping you identify trends, such as whether velocity is typically dominated by small or large fluctuations.
Additional Customization Options
The Average Velocity tool offers flexibility for your analyses. For instance, the units of velocity can be adjusted between Auto, pm/fs, A/ps, and m/s. This ensures compatibility with different scales and systems being studied.
Connecting Forces to Motion
If you’re intrigued by what’s driving the velocity changes, comparing this analysis with Average Force might reveal valuable insights. It’s a powerful way to connect the application of forces to the resulting motion.
Learn more about the parameters, usage, and mathematical formulation of Average Velocity in the official documentation at this link.
SAMSON and all SAMSON Extensions are free for non-commercial use. You can get SAMSON at https://www.samson-connect.net.