



For molecular modelers and structural biologists, understanding protein behavior often hinges on analyzing backbone conformations. A key challenge is determining how proteins fold, transition, and adopt secondary structures. This is where Ramachandran plots provide valuable insights. With SAMSON’s integrative molecular design platform, you can easily create and analyze Ramachandran plots to study phi/psi angles, secondary-structure preferences, and conformational outliers.
Why Ramachandran Plots Matter
Ramachandran plots visualize protein backbone conformations by plotting the phi (Φ) and psi (Ψ) torsion angles of amino acid residues. This helps identify regions of allowed conformations, structural outliers, and transitions along a path. Whether you are focused on a specific motif, loop, or the global conformational sampling of a protein, this tool enhances your ability to explore structural details.
Creating a Ramachandran Plot in SAMSON
To generate a Ramachandran plot using SAMSON, follow these simple steps:
- Open the Path Analyzer tool within SAMSON.
- Choose Ramachandran as the observable in the settings.
- Select the desired Path for tracking protein backbone conformations.
- Define a Residue or make a protein selection. For example, focus on a specific active site or select the entire protein to get a broader perspective.
- Click Add Scatter to generate the plot.
Fine-Tuning and Interpreting the Plot
The generated Ramachandran plot will display a scatter plot of phi angles on the x-axis and psi angles on the y-axis. Each valid residue in your selection contributes a data point across the path. You can refine your selection and adjust the parameters to dig deeper into specific regions of interest.
Interactive features make it easy to explore the data further:
- Clicking a scatter point moves the protein structure to the corresponding frame in the simulation path, allowing you to visualize the conformation.
- Double-clicking a point selects the corresponding residue within SAMSON for closer inspection.
Practical Tips for Better Analysis
Practical Tip
- Use focused residue selections (e.g., one loop or active site) for targeted analysis.
- Use broader protein selections to get an overview of global conformational dynamics.
- Combine Ramachandran plots with SAMSON’s Secondary Structure Content and RMSD Analysis tools for a more holistic understanding of protein behavior.
A Visual Example
The image below shows an example of a Ramachandran plot generated in SAMSON. Colored regions represent allowed and disallowed conformations, aiding in structural validation and exploration:
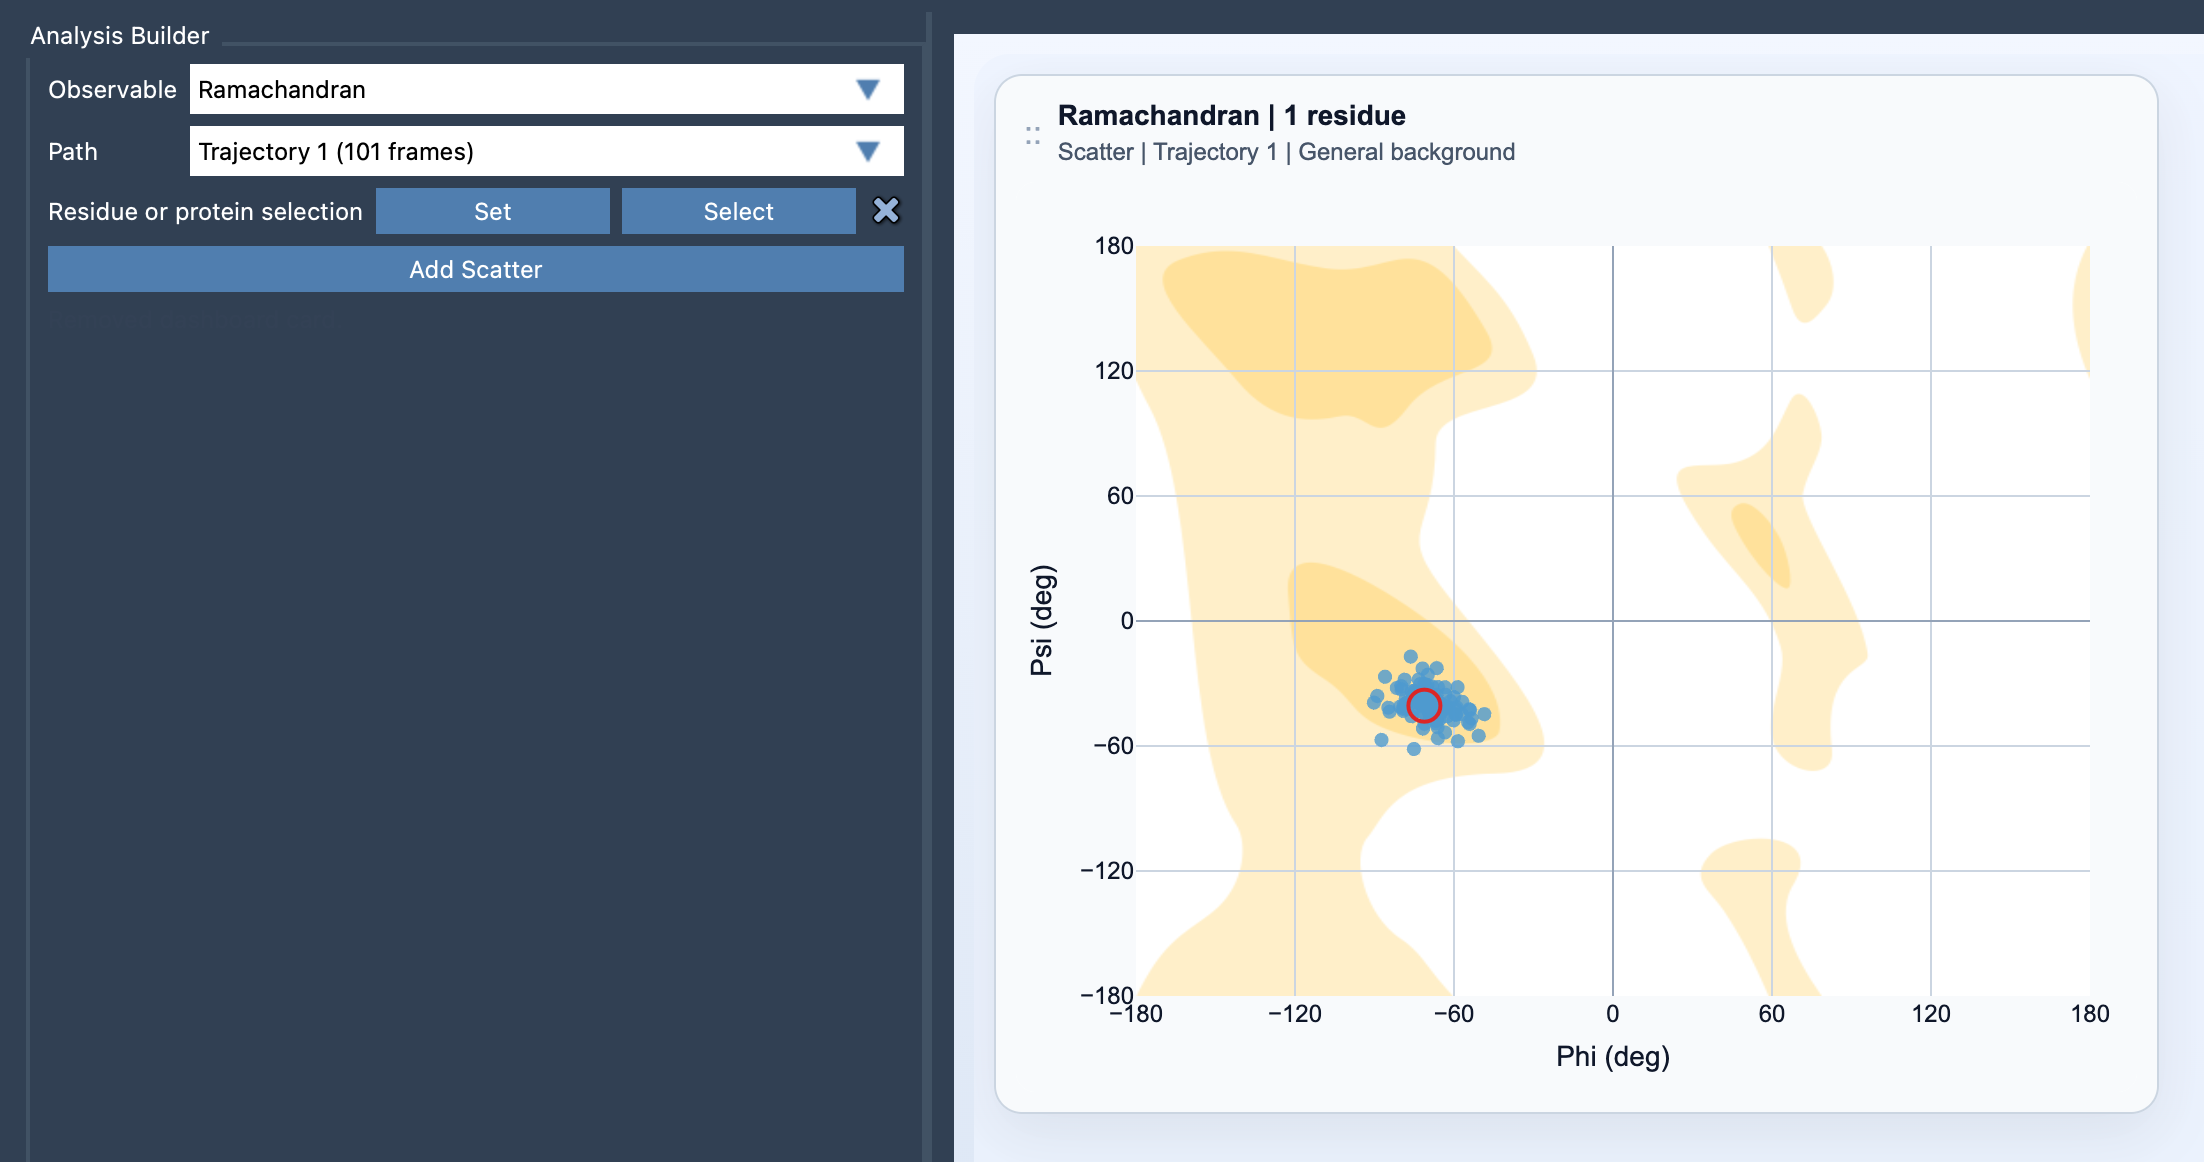
By leveraging Ramachandran plots within SAMSON, you can dive deeper into understanding conformational space, validate your molecular models, and pinpoint specific structural issues or interesting transitions.
To learn more about creating and analyzing Ramachandran plots in SAMSON, visit the documentation page: https://documentation.samson-connect.net/users/latest/references/path-analyzer/ramachandran/.
Note: SAMSON and all SAMSON Extensions are free for non-commercial use. You can download SAMSON at https://www.samson-connect.net.