Understanding how molecules interact along a reaction coordinate is a key step in molecular design. However, computing the Potential of Mean Force (PMF) often requires juggling multiple scripts, preparing files, and sorting out outputs that aren’t always intuitive. If you’ve been through umbrella sampling simulations but find transforming that data into a meaningful PMF daunting, the WHAM Analysis tool in the GROMACS Wizard might be exactly what you need—and it doesn’t require any manual scripting.
One challenge modelers often face is organizing and accessing their simulation data for PMF computations. GROMACS Wizard in SAMSON streamlines this by allowing users to load and analyze simulation folders automatically.
Organizing your umbrella sampling data
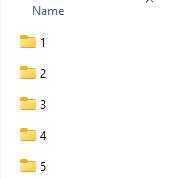
If your simulation was the result of batch computations, ensure your input folder has properly numbered subdirectories—each representing a window along the reaction coordinate. Each subfolder should contain the relevant GROMACS output files. Here’s an example of what your folder should look like:

Using the WHAM Analysis tab
Switch to the WHAM Analysis tab in GROMACS Wizard. You can manually choose your project folder, or let GROMACS Wizard auto-fill the path based on recent simulations by clicking the auto-fill button:
![]()
The tool automatically loads details like reaction coordinate names and bounds, simulation time, and temperature. This reduces the clean-up and preparation work that often accompanies PMF analysis.
Customizing and computing
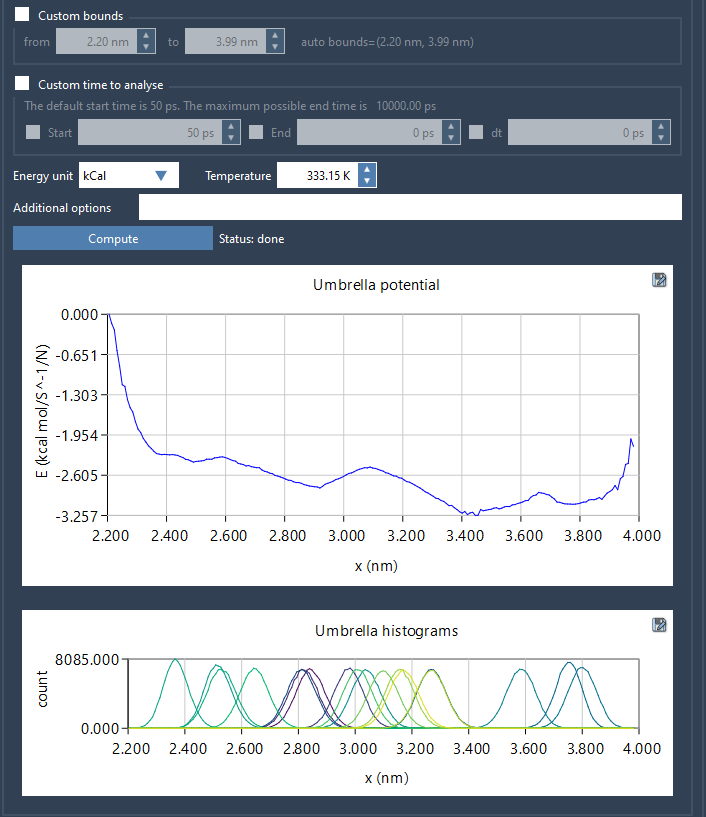
After selecting a reaction coordinate, you can set custom bounds, time limits, or energy units before computing. Once you hit Compute, the analysis begins—no command-line tweaking needed. For longer trajectories, the process may take a few minutes. When done, you’ll get two graphs: the PMF profile and its corresponding histogram.

The PMF profile shows the energy landscape along your reaction coordinate, while the histogram lets you assess how well the coordinate space was sampled. If some regions are under-sampled, the histogram provides a clear indication that more simulation points may be needed.
Keeping your results organized
GROMACS Wizard automatically saves plots and raw data in a dedicated wham_results subfolder within your project. Switching reaction coordinates from the list will re-use already computed data when available, saving computation time and keeping your workspace clean.
If you’re routinely performing umbrella sampling, this approach can seriously simplify your workflow while offering control and clarity around PMF results—with minimal setup.
To learn more about this feature and detailed instructions, visit the GROMACS Wizard PMF Analysis documentation page.
Note: SAMSON and all SAMSON Extensions are free for non-commercial use. You can download SAMSON at https://www.samson-connect.net.


