



For molecular modelers, understanding molecular interactions is crucial. Complex structures like protein-ligand complexes often require insightful visualization to unravel their dynamics. If you’ve faced frustration aligning 3D models with 2D diagrams or interpreting binding pockets, SAMSON’s Interaction Designer offers a powerful, integrated solution you may want to explore.
Simplify with Automatic Interaction Diagrams
The Interaction Designer streamlines the process of visualizing and analyzing molecular interactions. With just a few clicks, you can automatically generate detailed 2D interaction diagrams using the Home > Diagram command. Whether working with a selected portion of your structure or an entire molecular document, the tool creates synchronized visualizations, bridging your 2D diagrams and 3D viewport seamlessly.

Why Use 2D Interaction Diagrams?
Generated interaction diagrams bring several advantages:
- Binding Pocket Visualization: Zoom in on a ligand’s binding location within a protein to better understand interaction mechanisms.
- Solvent Accessibility Display: Determine which ligand atoms are exposed to solvents, aiding in evaluating molecular properties.
- Clear Interaction Details: The diagram highlights residues, structural groups, and specific atom interactions (e.g., hydrogen bonds, ionic interactions, steric clashes). Learn more about supported contact types here.
Additionally, diagrams are interactive. You can control the layout, hide or show interactions, and adjust colors directly through the interface for clear, publication-ready graphics.
Editing and Customizing Diagrams
Unlike static representations, the Interaction Designer provides flexibility in diagram editing. Move labels and interaction symbols, change their colors, or hide specific elements by interacting with the legend or directly clicking components. This lets you tweak the visualization for clarity and presentation.
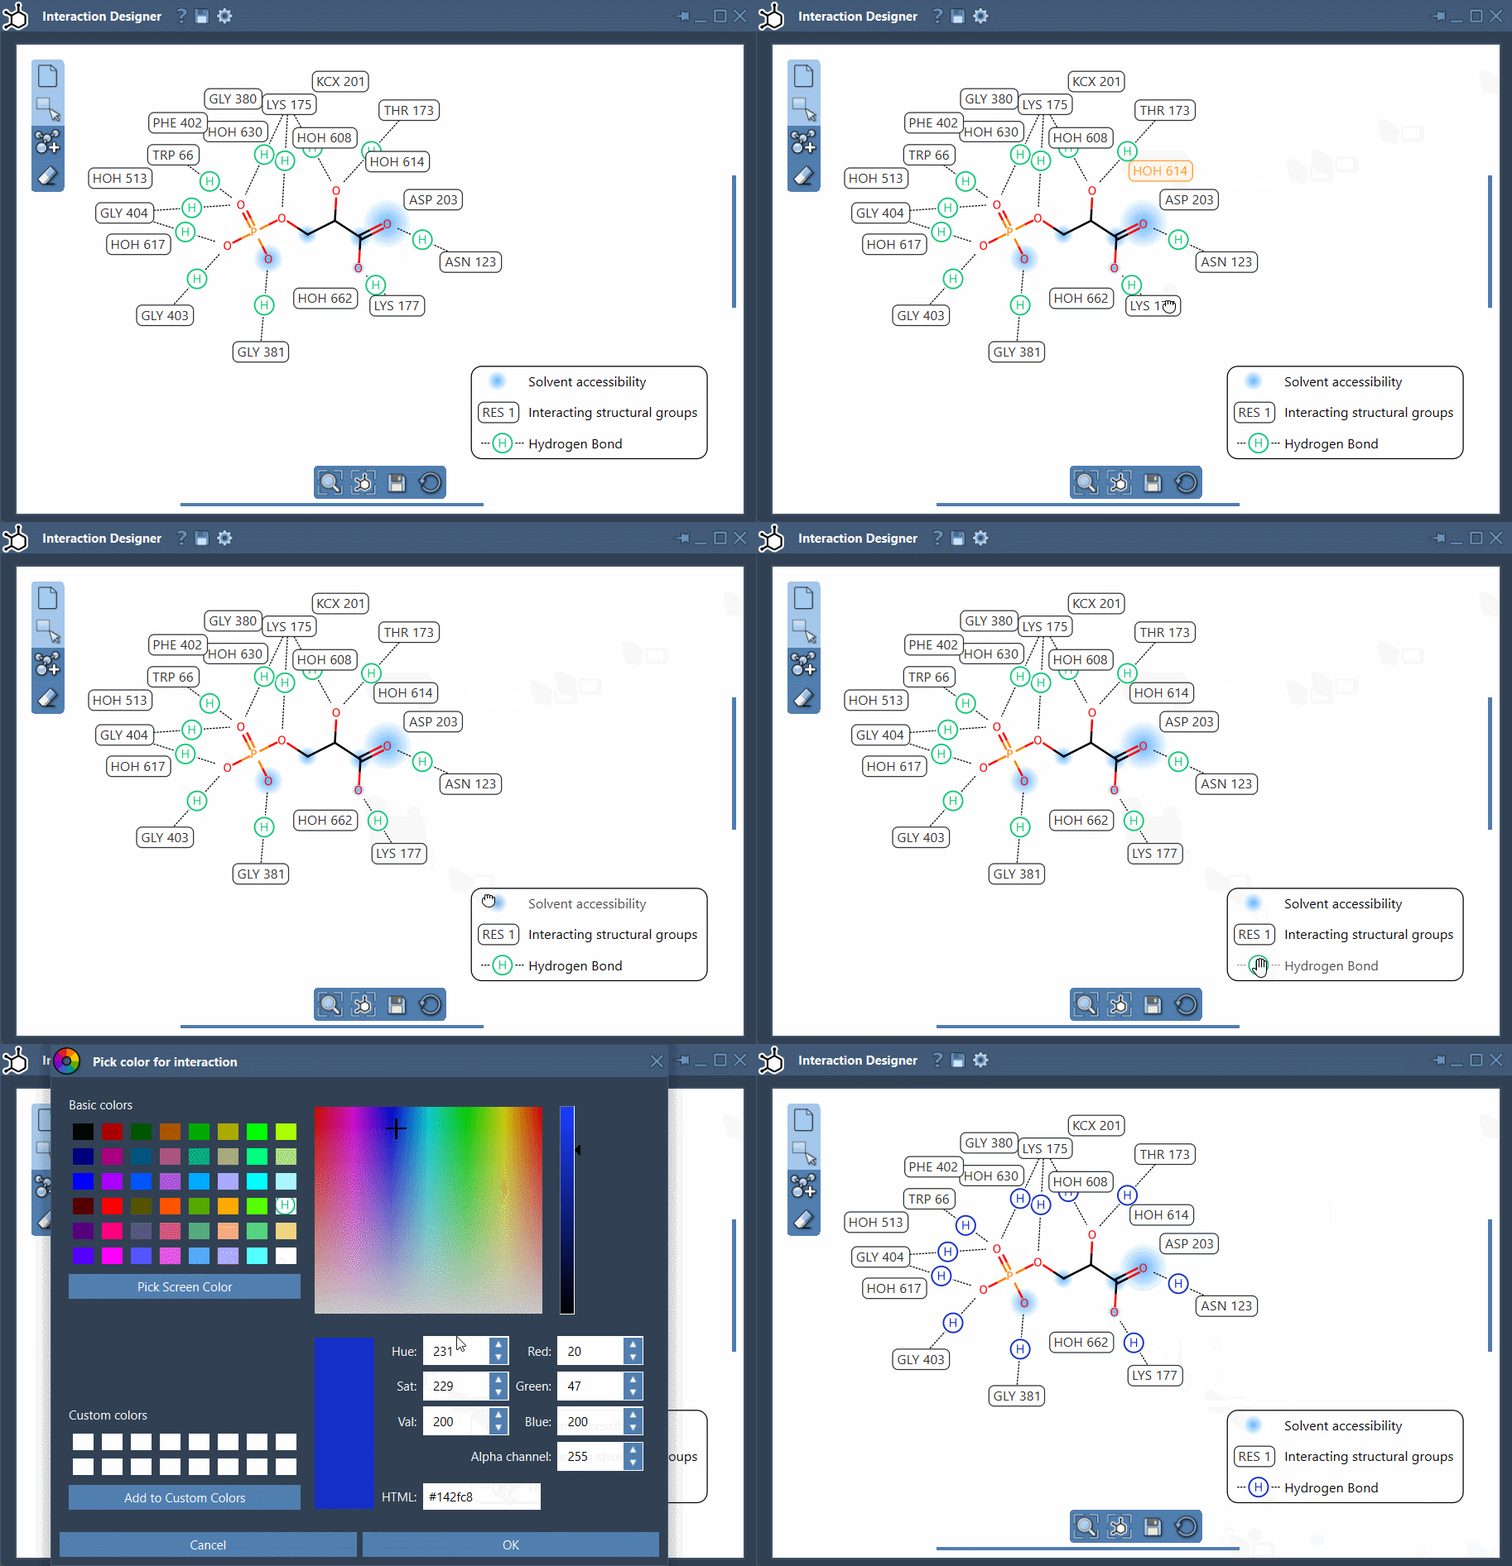
Integrated 2D and 3D Environment
The synchronization between 2D diagrams and the 3D viewport is a noteworthy feature of the Interaction Designer. This means that any changes you make to the 3D model—adding, deleting, or selecting atoms—will immediately reflect in the 2D diagram. As a result, structural modifications and interaction analyses remain aligned, saving time and reducing errors compared to manually transferring updates between two separate views.
Zooming is intuitive too. Use Ctrl/Cmd with the mouse scroll to zoom in or out, and drag diagrams to translate them as needed. These simple features add convenience, especially when examining intricate molecular regions.
Exporting Your Work
Do you need to share your diagrams as high-quality visuals? Exporting interaction diagrams is straightforward. You can save them in various image formats (like PNG, SVG, JPG) by clicking on the  Save button in the Interaction Designer. This capability makes it easy to include these visualizations in presentations, publications, or collaborative materials.
The Interaction Designer proves essential for molecular modelers who wish to better see, analyze, and interpret the subtle yet crucial interatomic relationships within macromolecular systems.
Learn more or get started by visiting the complete documentation here: Interaction Designer Documentation.
*Note: SAMSON and all SAMSON Extensions are free for non-commercial use. Download SAMSON from SAMSON Connect.*