



For molecular modelers, ensuring the accuracy and stability of protein structures is essential. One common challenge encountered is addressing strained or unfavorable backbone conformations before simulations or structure refinement. The Ramachandran plot, a cornerstone in structural biology, is an invaluable tool for this task. But how can you make the most of it efficiently? SAMSON’s Interactive Ramachandran Plot Extension might just be the solution you’re looking for.
What is the Ramachandran Plot?
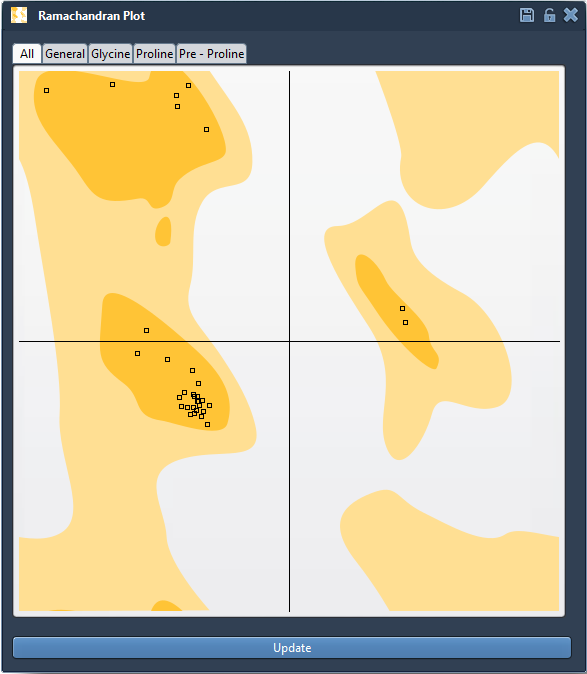
The Ramachandran plot visually represents the energetically allowed regions for backbone dihedral angles φ (phi) and ψ (psi) in amino acids. By plotting these angles, the chart highlights preferred conformations in yellow areas (energetically favorable regions) and less favorable conformations in white areas. This makes it much easier to locate residues that may be in strained or disallowed conformational states.
How Does the Interactive Ramachandran Plot Help?
Normally, analyzing residues in a Ramachandran plot can be a static experience, leaving you to interpret information without direct feedback on your dataset. SAMSON’s Interactive Ramachandran Plot takes things further: it allows you not only to visualize φ and ψ distributions but also to manipulate them interactively and explore the immediate impact on your protein structure.
Highlight Features:
- Real-time residue selection: Click any point on the plot to select the associated residue in the 3D view. This lets you seamlessly connect the 2D data with the structural context in your model.
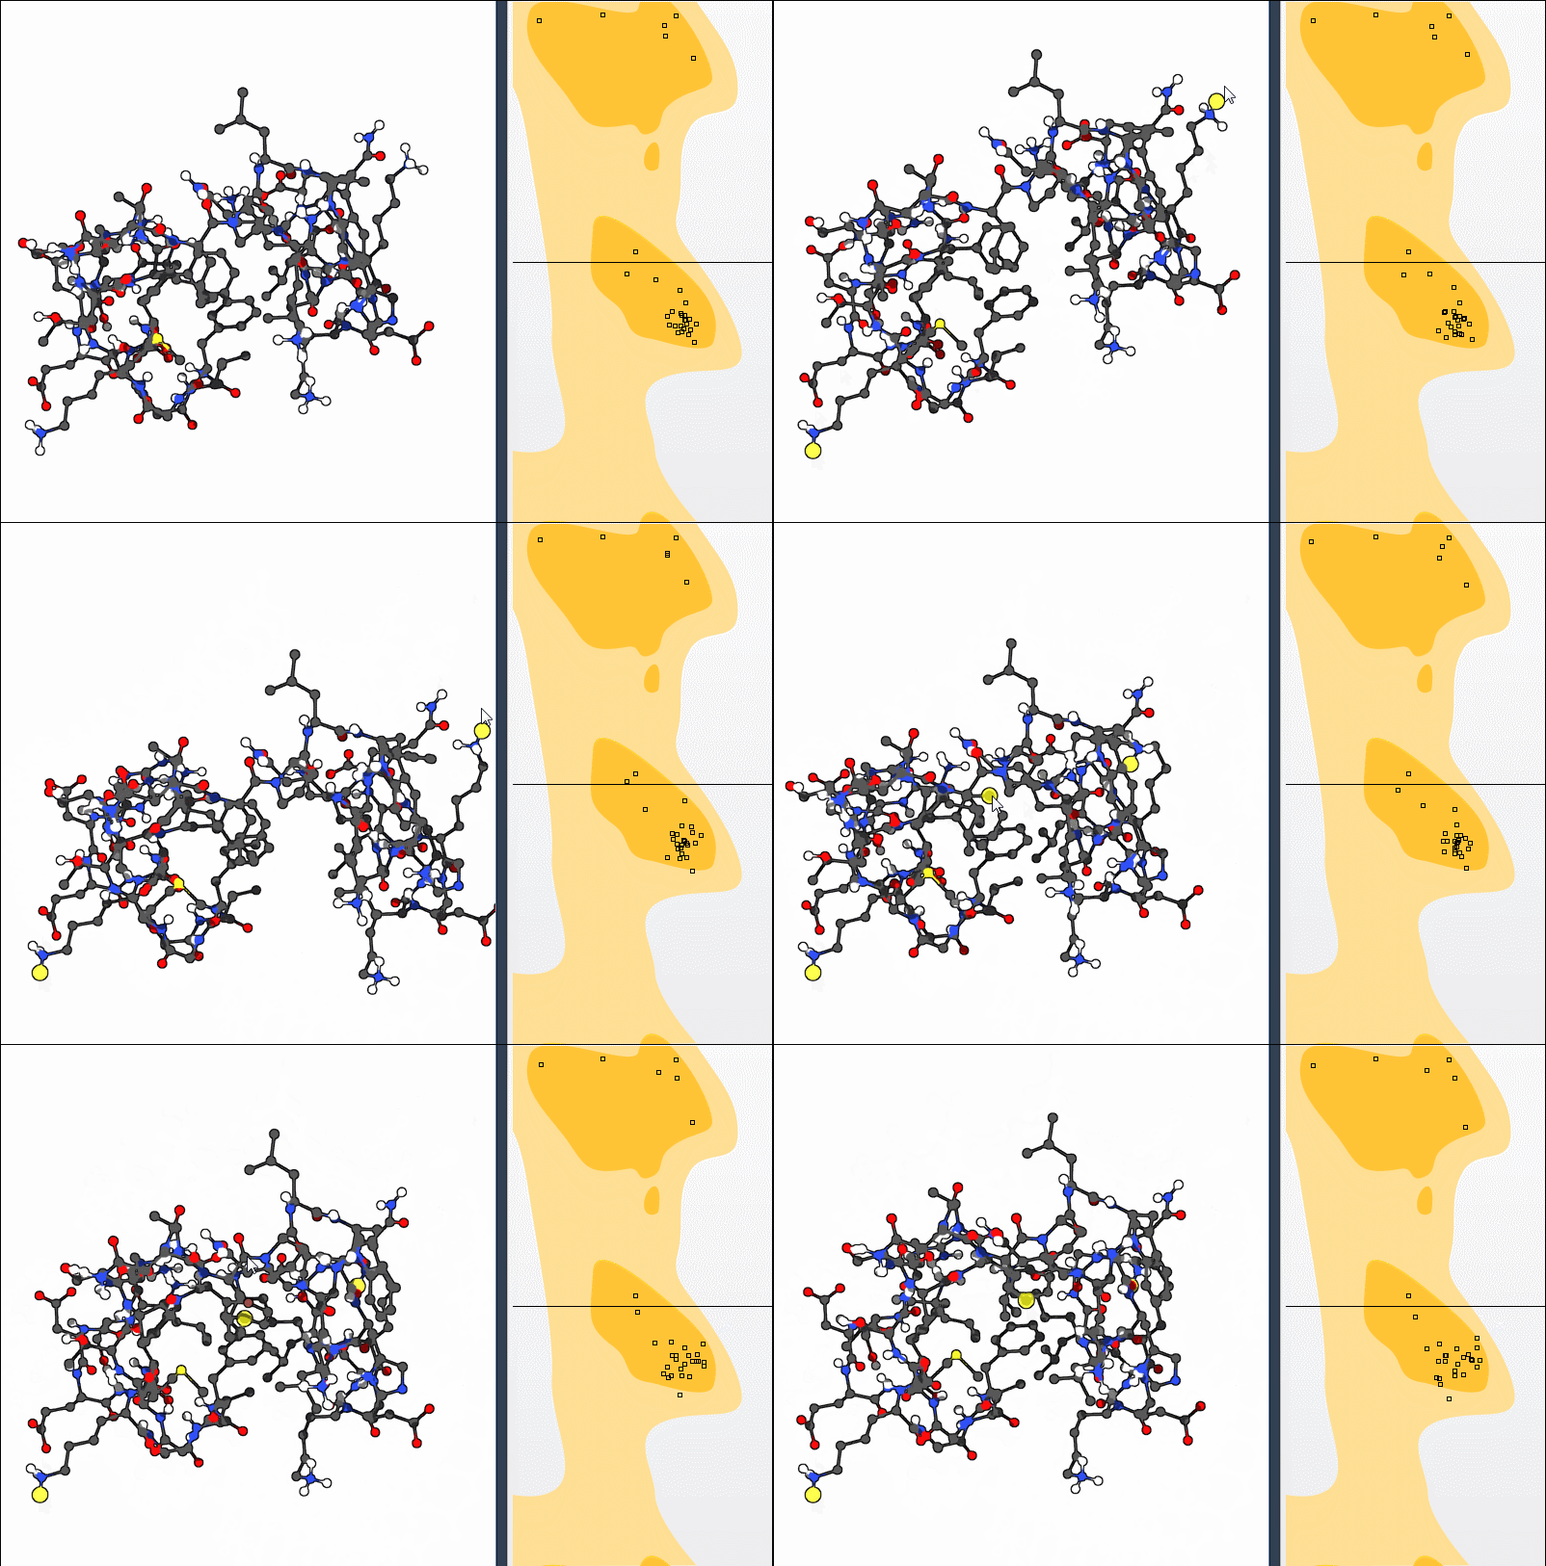
- Interactive editing: You can drag and reposition points within the plot to alter dihedral angles directly. The changes are reflected in real time in the 3D viewport for instant feedback and refinement.
- Residue categorization tabs: Filter residues by groups such as General, Glycine, Proline, and Pre-proline to focus on regions of interest.
Making Structural Adjustments
Option 1: Drag Points Directly in the Plot
- Select a residue in the plot and drag it to a more favorable position within the chart. This instantly updates the φ and ψ angles for that residue in your protein structure.
- If necessary, you can use Ctrl/Cmd + Z to undo changes and reset the structure.
Option 2: Use the Twister Editor for Precision
If you wish to make manual, structured adjustments in 3D, the Twister Editor is a powerful alternative. You can twist or rotate dihedral angles in real time while observing how these changes impact a residue’s placement on the Ramachandran plot. This method is highly useful for making larger-scale structural changes while preserving overall geometry.
Applications for Molecular Modelers
The Interactive Ramachandran Plot has applications across several protein modeling workflows:
- Detect and resolve strained residues: Quickly identify outliers in the plot and refine their angles to fall into energetically favorable regions.
- Improve homology models: Use the plot to adjust potentially erroneous backbone conformations, improving model accuracy ahead of any further refinement or docking simulations.
- Understand structural flexibility: By visualizing and tweaking dihedral angles, gain insights into the conformational flexibility of important residues, such as those in active sites or binding interfaces.
To master these techniques and begin using the Interactive Ramachandran Plot in SAMSON, follow this tutorial for detailed guidance: SAMSON Ramachandran Plot Documentation.
SAMSON and all SAMSON Extensions are free for non-commercial use. Download SAMSON now at SAMSON Connect.