



Visualizing molecular motion is crucial for understanding complex biological processes such as ligand unbinding, protein conformational shifts, and diffusion. However, extracting and interpreting these motions can often be challenging for molecular modelers. Did you know that SAMSON, the integrative molecular design platform, provides a specialized tool—Pathlines visual model—to simplify this process?
What Are Pathlines?
The Pathlines visual model in SAMSON enables researchers to track the center-of-mass (COM) trajectory of selected atoms along predefined paths. Whether you’re studying ligand unbinding mechanisms or collective domain motions in proteins, Pathlines offers an elegant solution to observe and analyze how atoms or groups move during simulations.
Step-by-Step Guide to Visualizing Center-of-Mass Motion
Step 1: Load the Sample System
If you’re new to Pathlines, SAMSON provides a prepared sample system for practice, which includes a structural model of Lactose permease (1PV7) and its ligand TDG, accompanied by unbinding paths generated by the Ligand Path Finder extension. To load this sample:
- Click Home > Download in SAMSON.
- Paste the following link into the download field: https://www.samson-connect.net/documents/046f1acd-c799-40f6-8185-cb4847eff795.
- Click Download, and the system containing the protein, ligand, and paths will load.

Step 2: Select Atoms and Paths
To create the COM pathlines, select atoms (for which you want to track the motion) and the paths in the Document view. If no atoms are selected, SAMSON will use the entire system by default. If no paths are selected, all paths will be included.
An easy way to select multiple nodes is by holding the Ctrl (Windows) or Cmd (Mac) key during selection.

Step 3: Generate the Pathline Visual Model
Once your selections are made, follow these steps to create a Pathline visual model:
- Go to Visualization > Visual model > More… or use the shortcut Ctrl/Cmd + Shift + V.
- In the dialog box, select Pathline of the center of mass and click OK.
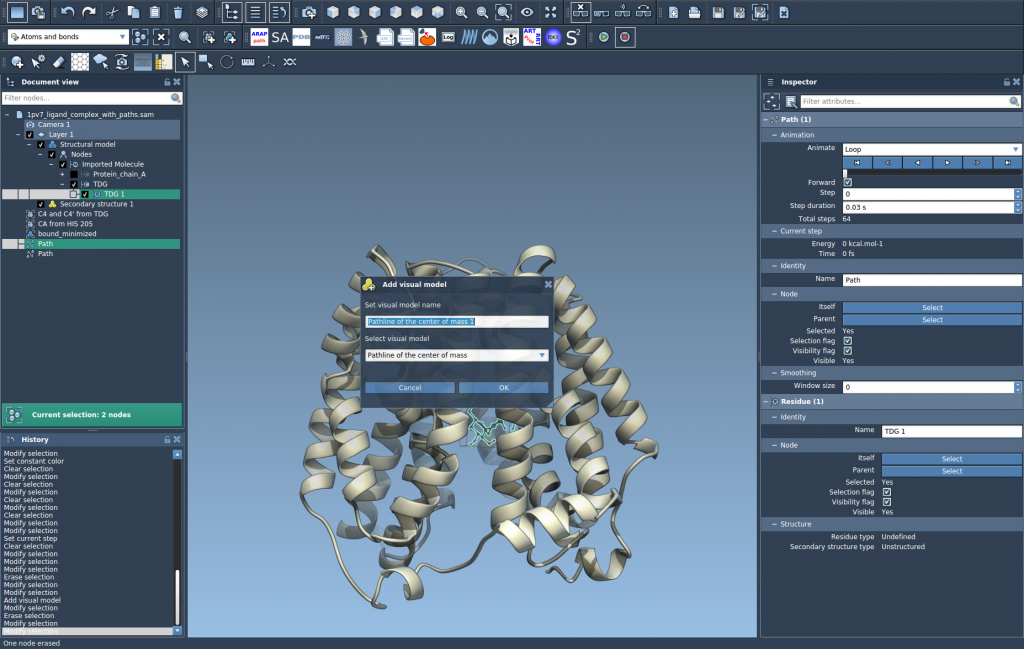
At this point, SAMSON will generate a pathline reflecting the motion of the selected atoms along the specified paths.
Step 4: Customizing and Exploring
The Pathlines tool doesn’t just highlight the motion; it also allows customization and exploration to better suit your research needs. Here are a few tips:
- Double-click a path to start or stop viewing it in the Document view.
- Access additional actions for paths with a right-click context menu (Path > …).
- Modify visual properties such as the color or thickness of the pathline through the Inspector panel (Ctrl/Cmd + 2).
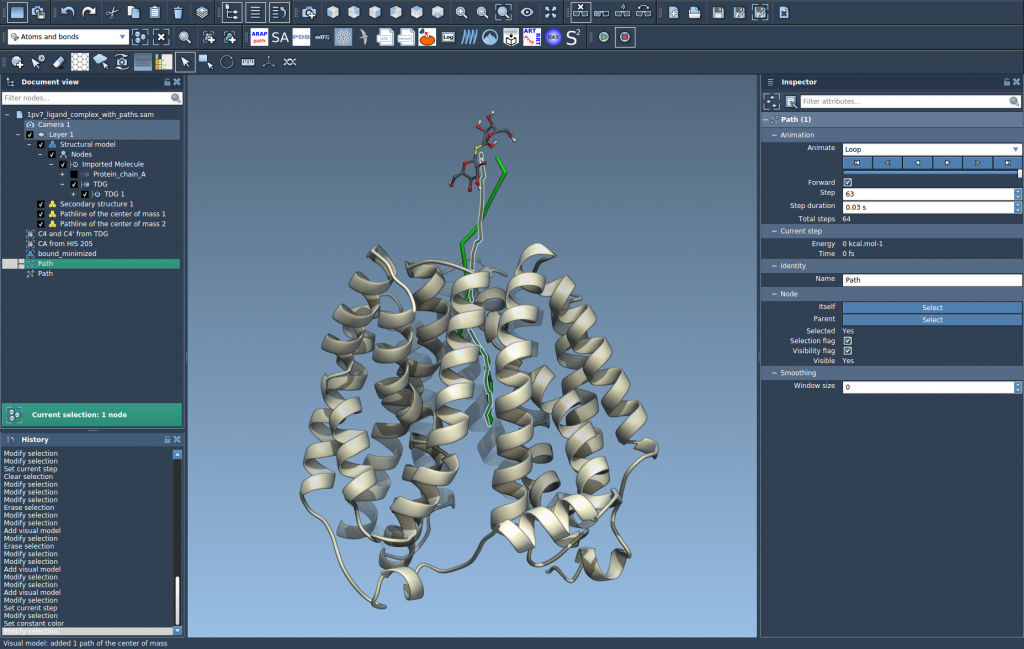
These features allow you to fine-tune the visual output, making it easier to interpret and present molecular dynamics effectively.
Applications of Pathlines
Pathlines are not just visually compelling; they offer profound insights into molecular phenomena. Some of their key use cases are:
- Displaying ligand unbinding/rebinding routes in molecular complexes.
- Analyzing collective motion of protein domains in simulations.
- Tracking reaction coordinate movements in custom workflows.
If you’re ready to explore the Pathlines visual model and its capabilities further, check out the full tutorial documentation.
Note: SAMSON and all SAMSON Extensions are free for non-commercial use. Download SAMSON at https://www.samson-connect.net.