



When working with molecular modeling and simulations, datasets often have a noisy or uneven distribution of scalar values such as distances, energies, or RMSD. These fluctuations can make it challenging to identify meaningful patterns or trends. This is where density curves come in as an invaluable tool to turn a noisy dataset into a clear, smooth, and interpretable landscape.
What Is a Density Curve?
A density curve is a smooth one-dimensional representation built from a series of scalar values. It acts as a refined alternative to histograms, offering an easier-to-read visualization of data distributions without the sharpness and dependency on bin sizes typically associated with histograms. This can be particularly useful in molecular modeling where understanding preferred states or configurations is critical.
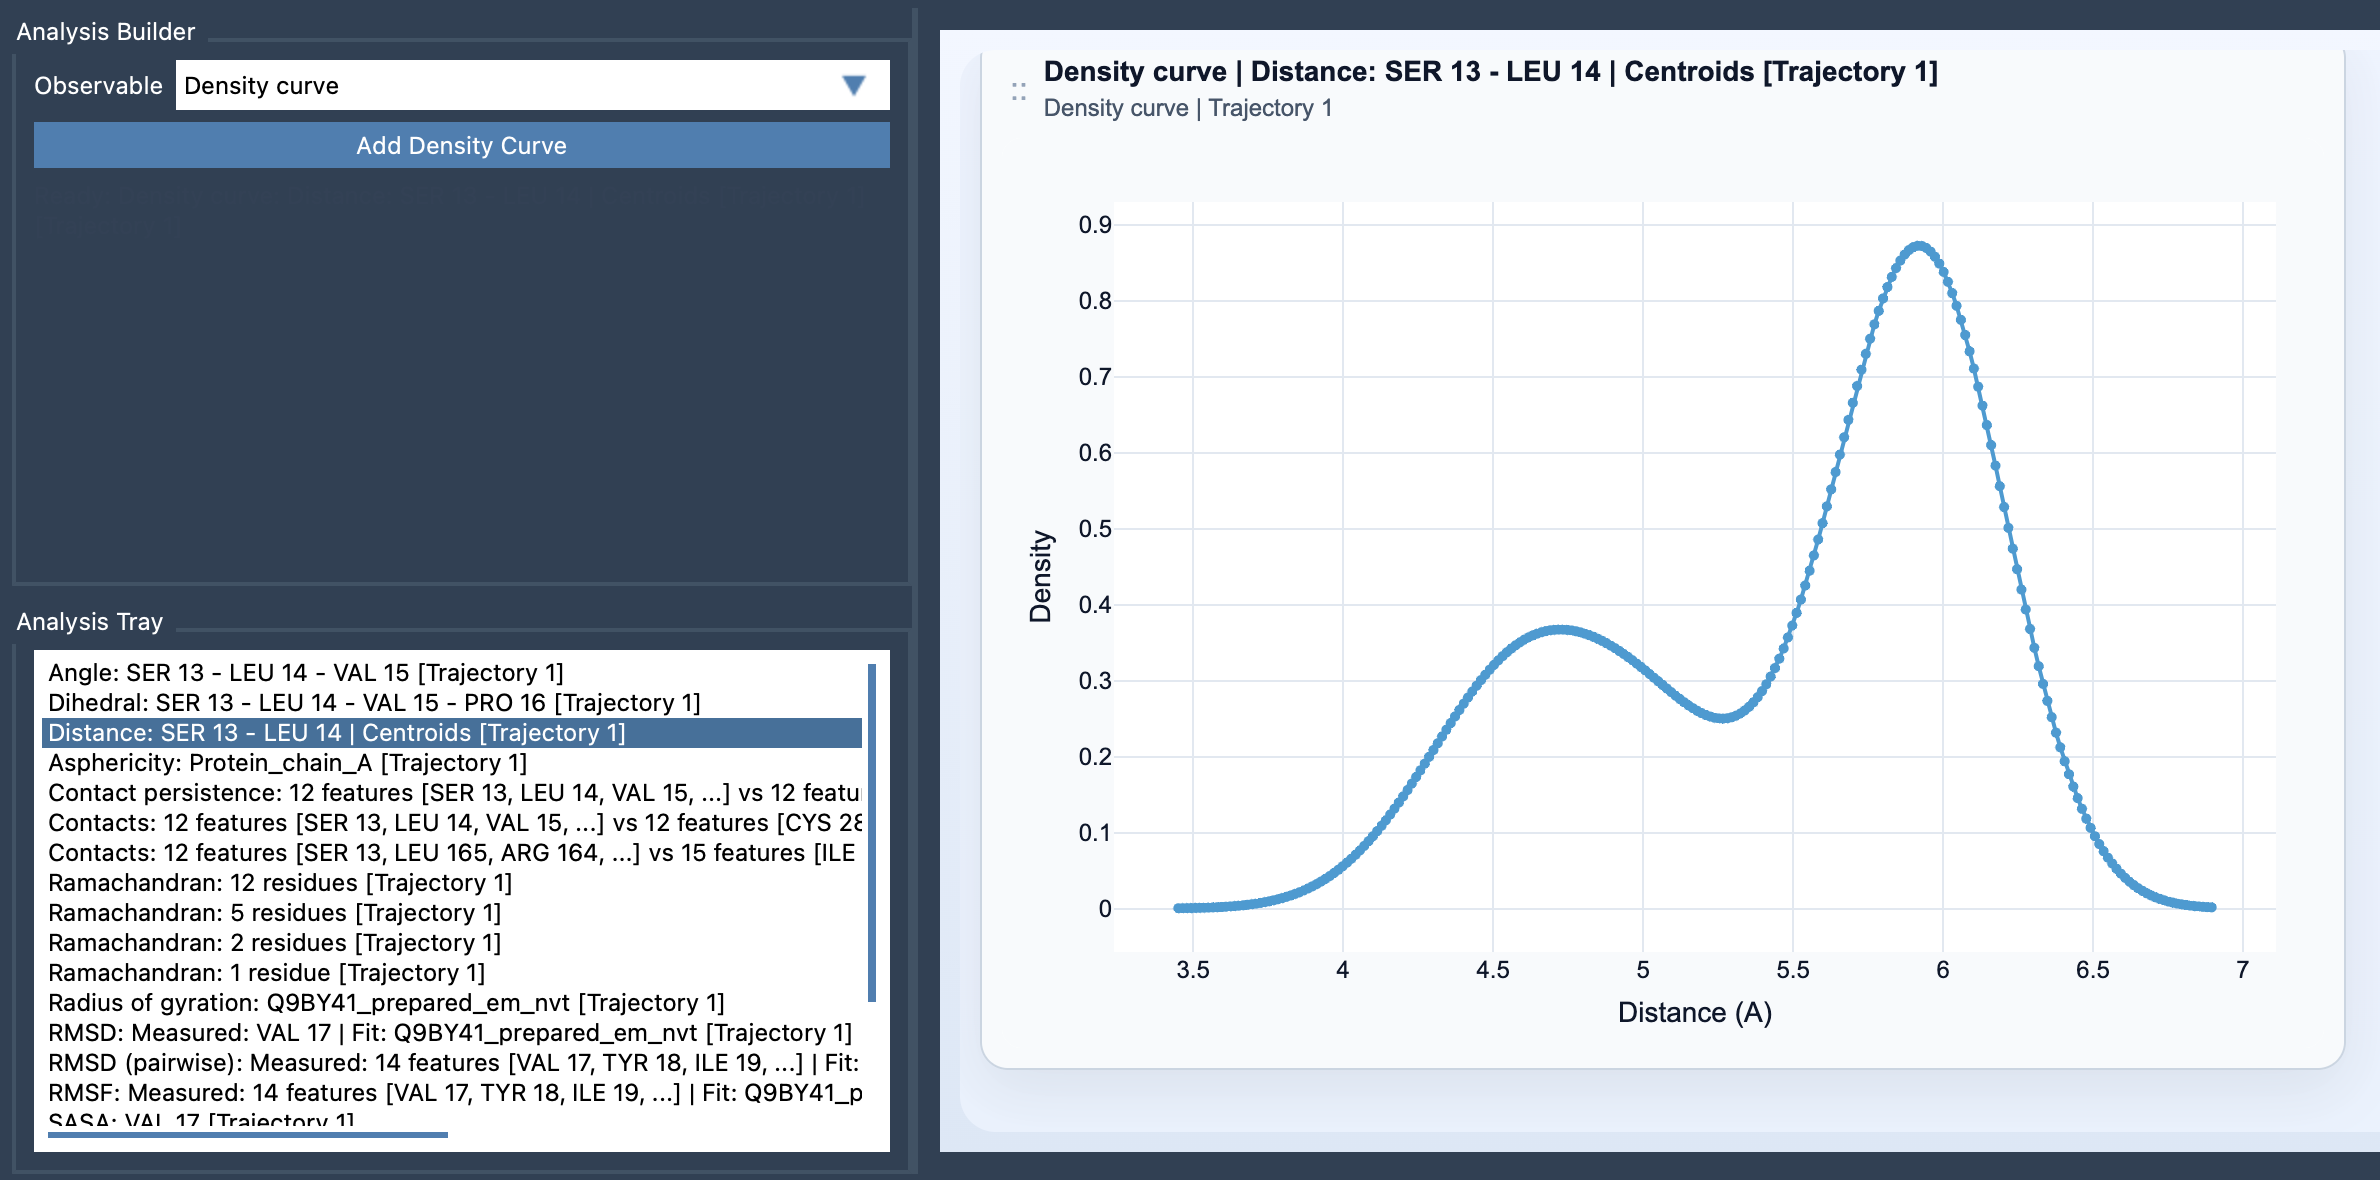
The Density Curve feature in the SAMSON molecular design platform does exactly this. Once you have a scalar analysis (e.g., a saved dataset of distances or energy values) ready in your Analysis Tray, you can use the Density Curve feature in the Path Analyzer to generate a smooth visualization of the data.
How to Add a Density Curve in SAMSON
Here’s a quick guide to adding a density curve:
- Open the Path Analyzer in SAMSON.
- Create or select a scalar analysis (e.g., Distance, RMSD, Energy) in the Analysis Tray. You can either create a new one based on your current model or reuse an existing analysis.
- Under the Observable section, choose Density Curve.
- Select exactly one saved scalar analysis in the tray to serve as the basis for the density curve.
- Click Add Density Curve. That’s it! SAMSON will generate a smooth density plot to help you interpret your data more effectively.
Applications of Density Curves
Density curves are not just an elegant visualization; they are highly practical for various stages of molecular modeling workflows. Key use cases include:
- Identifying preferred spatial, energetic, or conformational states of a molecule or system.
- Simplifying comparisons between different datasets derived from simulations.
- Preparing for more advanced visualizations, such as 2D density maps or energy landscapes.
Moreover, density curves help address common challenges with histograms. Unlike histograms, which can be overly dependent on the number and size of bins, density curves produce a smooth estimate that gives a more general overview of data distributions. This can save time and effort when analyzing complex systems by allowing you to highlight trends faster.
How Density Curves Work
The Path Analyzer generates the density curve using a Gaussian kernel density estimation technique. Essentially, the scalar values are processed using a mathematical framework that ensures smoothness and avoids overfitting. SAMSON automatically determines a suitable bandwidth (h) parameter, which adjusts the level of smoothness for the curve.
Pro Tip for Molecular Modelers
Consider using density curves for datasets where histograms appear too jagged or fragmented. This feature is especially beneficial for summarizing value populations when you don’t need frame-specific details.
If you’re planning to build a 2D density map or an energy landscape, density curves can serve as a preliminary step to gain better insights into the underlying data.
To learn more, check out the full documentation page on Density Curves in SAMSON here.
Note: SAMSON and all SAMSON Extensions are free for non-commercial use. You can get SAMSON at SAMSON-Connect.