



If you’re a molecular modeler, you’ve probably faced the challenge of visualizing complex motions in biomolecular systems. Whether you’re analyzing ligand unbinding, domain movements, or reaction pathways, clarity can make a significant difference. This is where SAMSON’s Pathlines feature steps in, offering a streamlined way to monitor the center-of-mass (COM) trajectory of selected atom groups along defined paths.
Why Pathlines Solve Real Challenges
Understanding the movement of biological molecules is often essential to study processes like ligand binding/unbinding, protein conformational changes, or even diffusion. However, effective visualization of these motions can often be time-consuming. The Pathlines visual model in SAMSON was designed to simplify this process by illustrating the COM motion of selected atoms along predetermined paths. This enables molecular modelers to:
- Trace the motion of key ligands, residues, or atom groups.
- Visualize center-of-mass displacement clearly, often crucial for interpreting molecular dynamics simulations.
- Study dynamic processes such as unbinding paths or collective movements in large systems.
A Quickstart Guide to Pathlines
To utilize Pathlines effectively, follow these simple steps in SAMSON:
1. Load the Sample System
You can start by loading a pre-prepared sample system. Here’s how:
- Click Home > Download.
- Paste the document link: https://www.samson-connect.net/documents/046f1acd-c799-40f6-8185-cb4847eff795.
- Click Download.

The document contains a structural model of Lactose permease (1PV7), its ligand Thiodigalactosid (TDG), and unbinding paths generated using the Ligand Path Finder.
2. Select Atoms and Paths
Once the system is loaded, decide on the atoms and paths you’d like to track. By holding the Ctrl/Cmd key, you can select multiple nodes in the Document view. If no paths or atoms are selected, SAMSON automatically uses the full system and all paths in the document.

3. Create a Pathline Visual Model
Visualizing the chosen motions is straightforward:
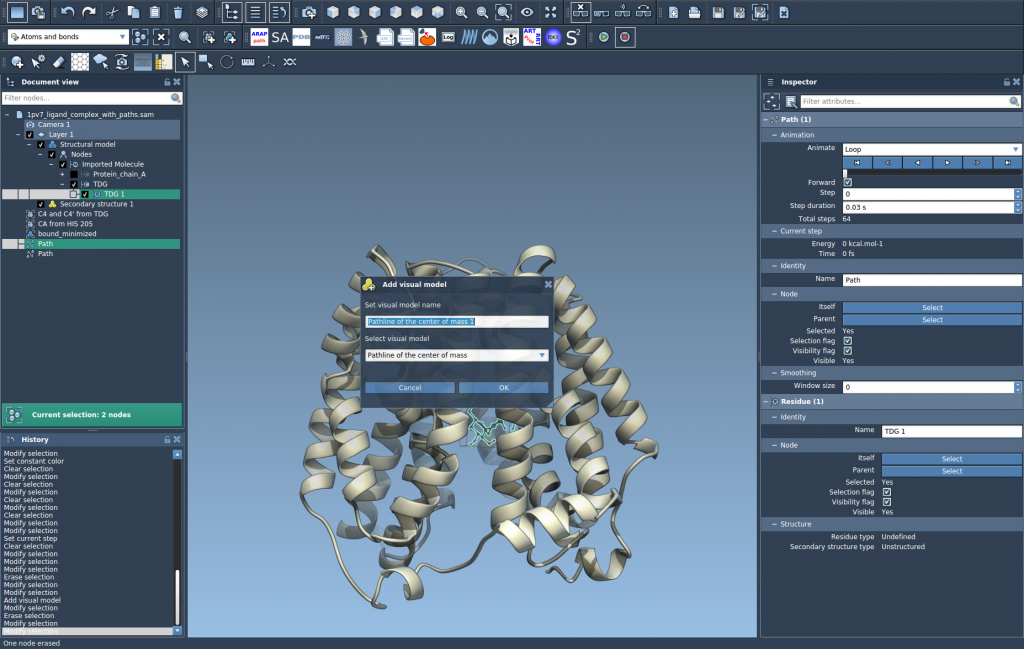
- Go to Visualization > Visual model > More… (shortcut: Ctrl/Cmd + Shift + V).
- Select Pathline of the center of mass in the dialog and click OK.
The result? A visual pathline representing the COM motion along the selected paths, enabling easy interpretation of molecular motions.
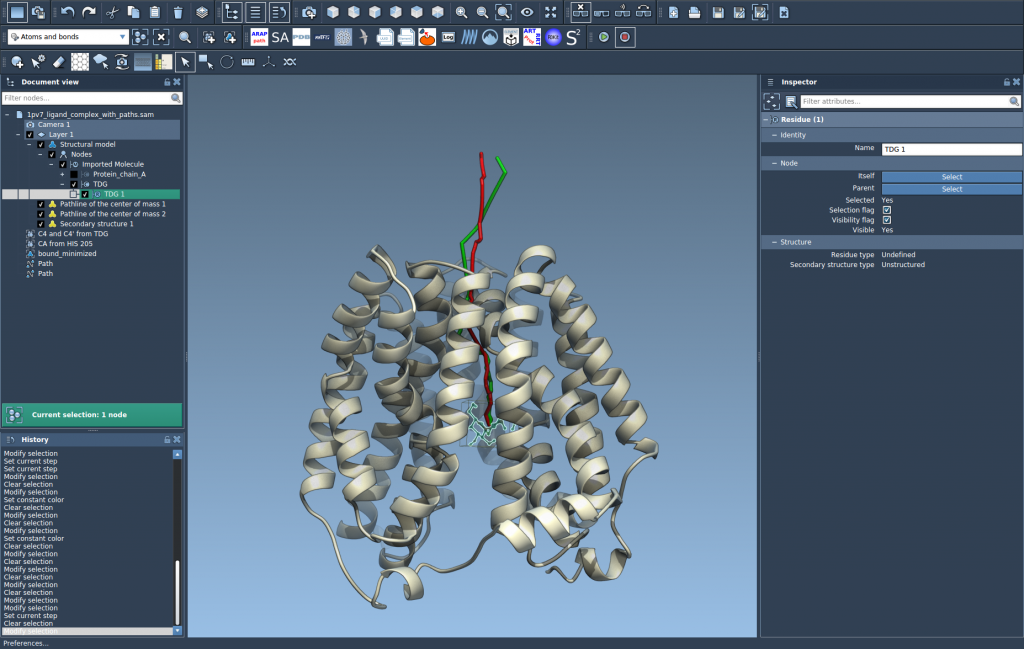
4. Explore and Customize
Once the pathline is generated, you can refine your visualization:
- Double-click a path in the Document view to toggle motion on/off.
- Right-click a path for additional editing options under Path in the context menu.
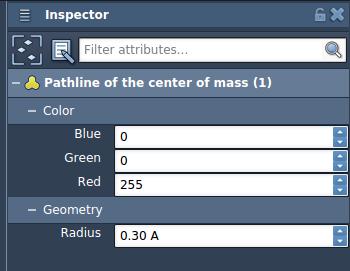
- Use the Inspector (Ctrl/Cmd + 2) to adjust properties like color or thickness for clarity.
Deleting a path or atoms associated with a pathline will update or remove the visualization dynamically.
Enhance Your Workflow
Combining Pathlines with other SAMSON tools, such as the Parallel Nudged Elastic Band (P-NEB), allows you to optimize transition paths and further enrich your studies.
Learn more about setting up and customizing Pathlines in the full documentation here.
Note: SAMSON and all SAMSON Extensions are free for non-commercial use. Get SAMSON here.