



When dealing with proteins, understanding their conformational behavior is crucial for molecular modeling. Yet, it often becomes tricky to inspect backbone conformations and detect irregularities within seconds. This is where the Ramachandran plot comes in – an invaluable tool offered by the SAMSON Path Analyzer to simplify this process.
What is a Ramachandran Plot?
The Ramachandran plot visualizes protein backbone conformations in phi/psi space (two torsion angles that define the backbone’s 3D shape). These plots not only allow you to identify stable secondary structural preferences (like alpha-helices and beta-sheets) but also point out outliers and backbone transitions. Whether you’re studying a single region or analyzing an entire protein, the Ramachandran plot provides a clear map to guide decision-making.
Set Up a Ramachandran Plot
In SAMSON’s Path Analyzer, setting up a Ramachandran plot is relatively straightforward. You can do this in five steps:
- Open the Path Analyzer in SAMSON.
- From the Observable dropdown, select Ramachandran.
- Choose a specific Path to analyze.
- Define your Residue or protein selection – this can be specific residues, loops, or even the whole protein.
- Click Add Scatter, and the Ramachandran plot will appear.
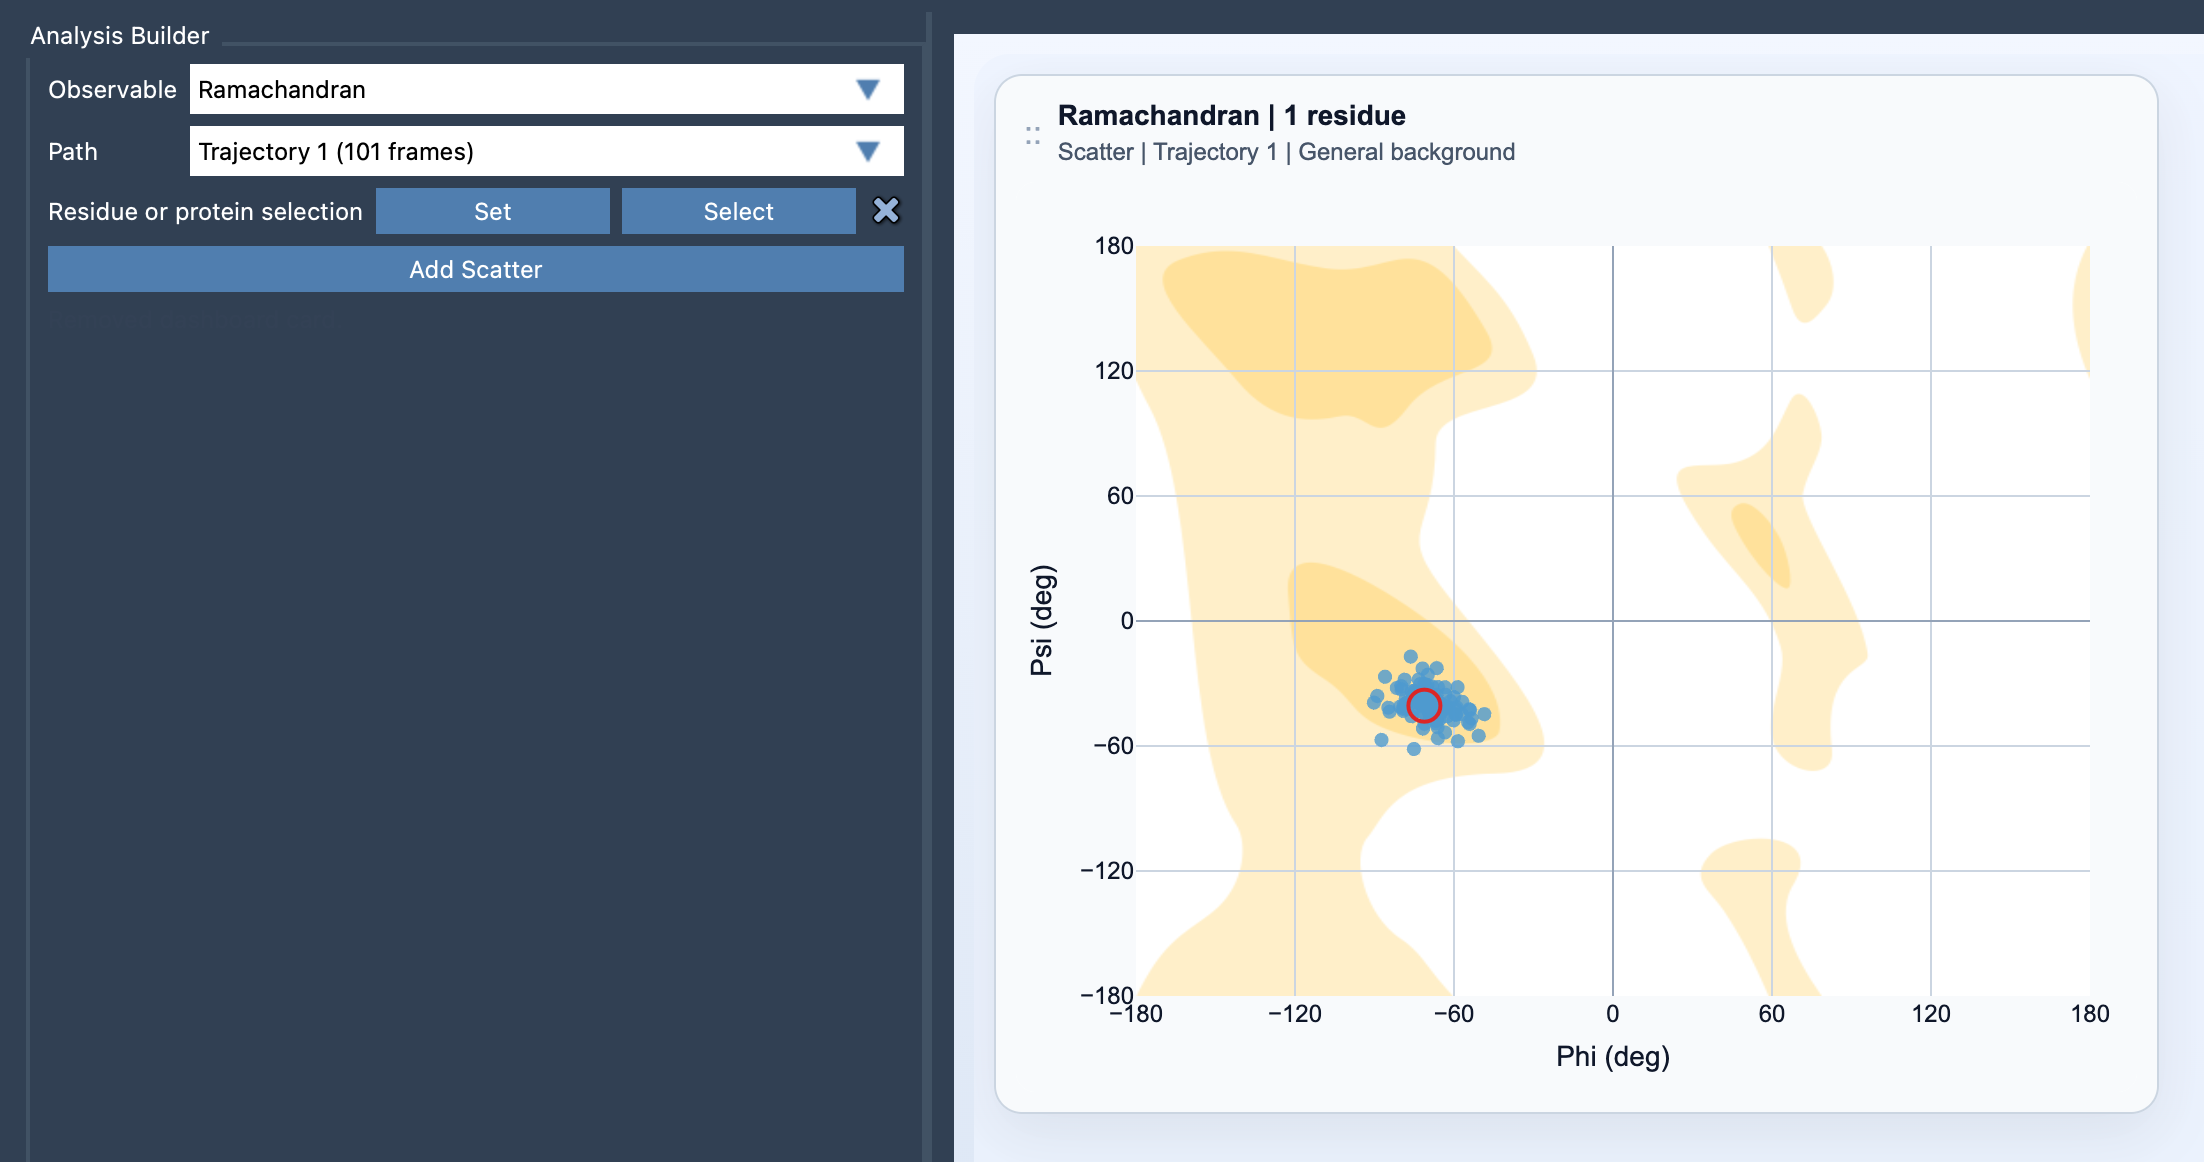
The plot is visually intuitive, with phi values on the x-axis and psi values on the y-axis. Each valid protein residue contributes a point to this map, allowing for a detailed inspection of the backbone’s conformational space. Backgrounds are auto-suggested by the platform but can be manually adjusted later in the card settings.
How to Use the Plot Effectively
The utility of the Ramachandran plot lies not only in mapping conformations but also in enabling interaction:
- Click a point: Instantly move the path to the corresponding frame in your simulation.
- Double-click a point: Automatically select the corresponding residue in SAMSON for further analysis.
Tips for Better Insights
As protein modeling often brings diverse goals, refining your residue selection can make the analysis more insightful. Here are a few tips:
- For specific regions (e.g., loops, motifs, or active sites), focus your residue selection to avoid unnecessary data clutter.
- For a global view, broaden the protein selection to track overall conformational sampling.
- Combine Ramachandran plots with additional tools like Secondary structure content and RMSD analysis for a comprehensive understanding.
Why it Matters
Proteins are highly dynamic molecules, and their function often depends on conformational flexibility. The ability to quickly spot outliers, understand transitions, or identify dominant structural motifs can save significant time during hypothesis generation, structural validation, or drug design workflows. With the Ramachandran plot integrated into SAMSON, you have a robust, accessible tool to achieve this analysis effortlessly.
For further details and step-by-step guidance, visit the official documentation page.
SAMSON and all SAMSON Extensions are free for non-commercial use. Get SAMSON from https://www.samson-connect.net.