



Molecular modelers often struggle with understanding torsion angles—those critical rotations between parts of a molecule that influence its conformations and functions. In this blog post, we’ll explore SAMSON’s Dihedral analysis, a tool designed to simplify tracking and analyzing molecular torsions. Whether you’re studying backbone twisting motions, rotamers, or torsion dynamics over time, Dihedral is a powerful feature to have in your toolkit.
Why Are Torsion Angles Important?
Torsion angles, defined by four sequential atomic groups, determine the 3D shapes and flexibility of molecular structures. They play a key role in protein folding, macromolecular interactions, and chemical reactivity. For modelers, measuring these rotations accurately along a trajectory or molecular path can unlock deeper insights into molecular behavior. That’s where SAMSON’s Dihedral analysis shines.
Getting Started: Adding the Dihedral Plot
Using SAMSON’s Dihedral analysis is straightforward. Here’s a step-by-step guide:
- Open the Path Analyzer module in SAMSON.
- In the Observable section, select Dihedral.
- Choose a Path or trajectory you wish to analyze.
- Define the four atomic groups that form the torsion: Group A, Group B, Group C, and Group D.
- Select your preferred visualization: Add Time Series to study torsional changes over time or Add Histogram to investigate preferred torsional states.
By following these steps, you’ll have a custom torsion plot ready for analysis, providing clear insights into structural dynamics.
Visualizing Torsion: Two Key Views
One of the standout features of SAMSON’s Dihedral analysis is its dual plotting modes:
- Time Series: Ideal for tracking torsional transitions as they happen along a path or over time. This view allows you to pinpoint exactly when and where conformational shifts occur.
- Histogram: Perfect for identifying preferred conformational states at a glance. This view is especially useful for spotting metastable conformations quickly.
If you’re unsure which view to use, a pro tip is to pair both plots. Start with a histogram to find stable states, then dive deeper using the time series view to analyze transitions in detail.
How Are Atomic Positions Calculated?
To compute the dihedral angle, SAMSON converts the four selected groups into representative positions:
- If a group contains a single atom, its atomic position is used directly.
- If a group contains multiple atoms, SAMSON calculates the center of mass of the group to represent its position.
This approach ensures robust and accurate measurements, even for groups of varying complexity.
Pro Tips for Advanced Analysis
- For a complete understanding of molecular conformational changes, pair the Dihedral analysis with RMSD or Energy analyses. This combination connects torsion changes to structural or energetic alterations.
- Focus on the histogram when rapid identification of metastable states is required.
- Use the time series view meticulously to investigate the precise moments of torsional transitions.
Example Visualization
The image below showcases a time series view of the torsion angle for a molecular path using the Dihedral analysis.
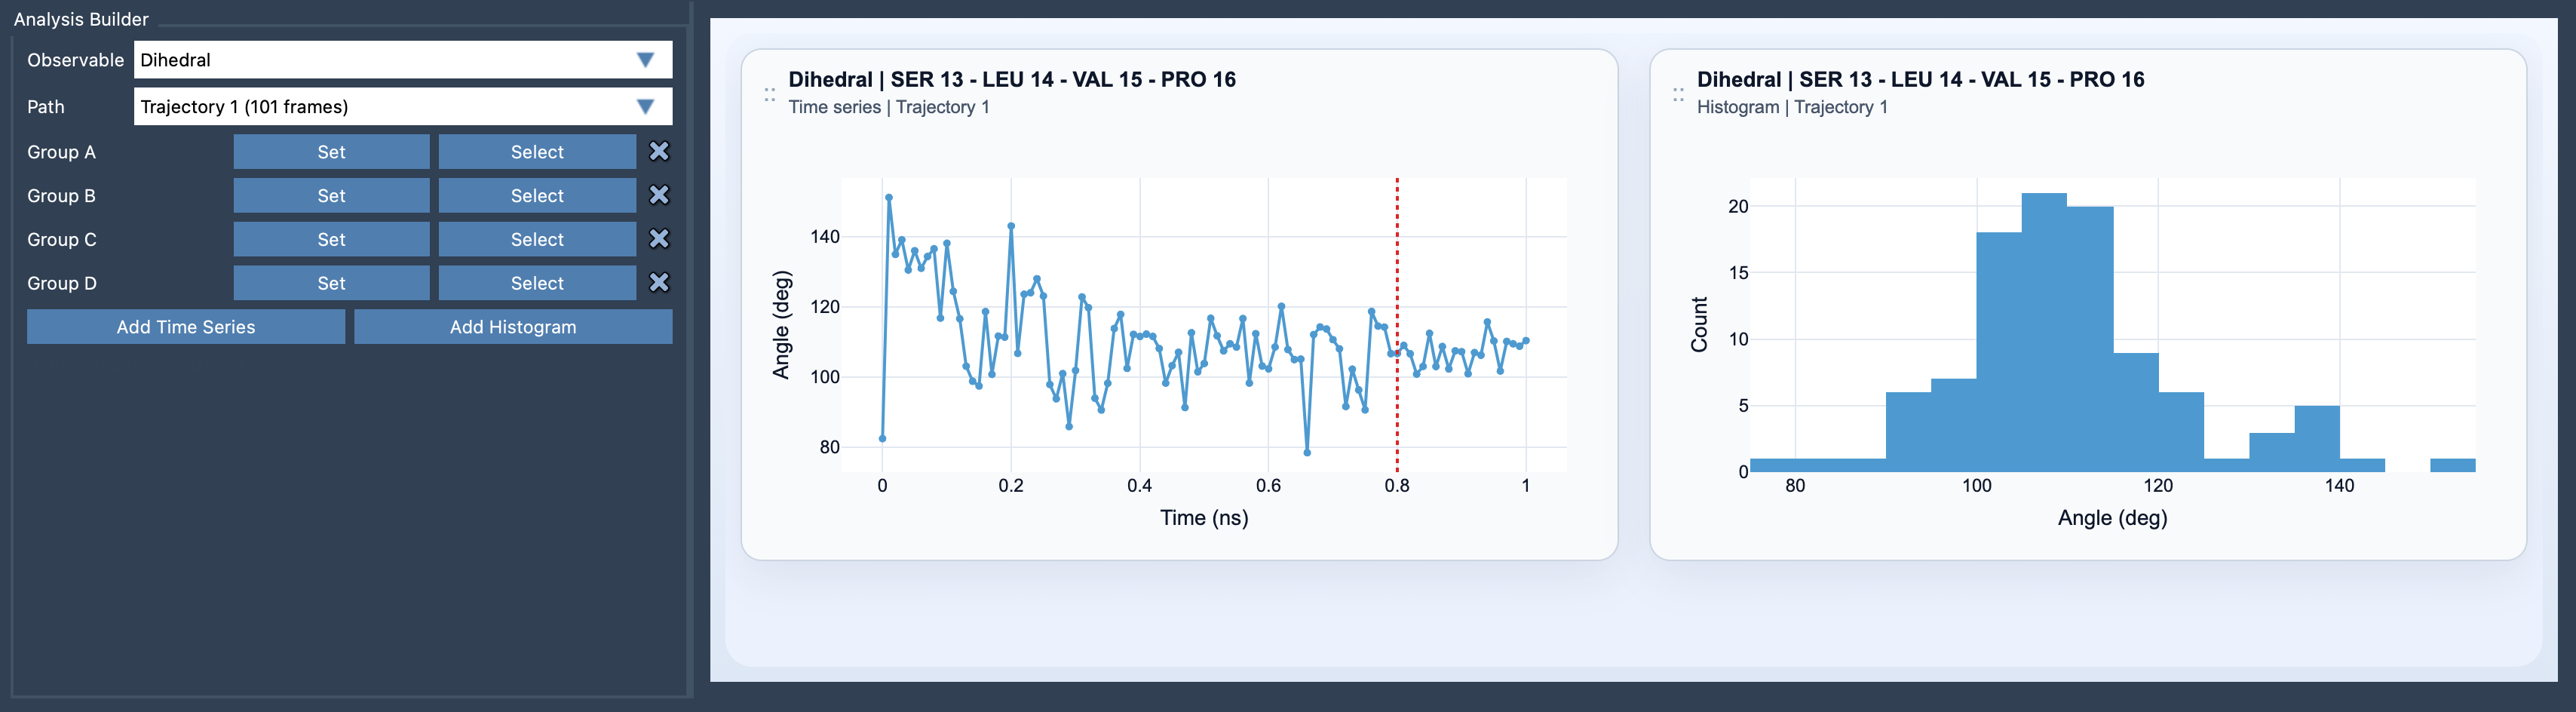
This clear presentation of torsional behavior provides molecular modelers with actionable insights and helps steer their research in the right direction.
To explore SAMSON’s Dihedral analysis in more detail, visit the full documentation page here.
SAMSON and all SAMSON Extensions are free for non-commercial use. You can get SAMSON here.