



A molecular structure can change shape in ways that are easy to miss if you track only its overall size. Imagine a group of atoms becoming more elongated while remaining about as large overall. A single distance-based summary may not make that change obvious. This is a common modeling challenge: how can you follow a group’s shape along a path without reducing the whole picture to one distance?
Asphericity in SAMSON’s Path Analyzer offers a compact way to monitor how far a selected group deviates from a spherical shape. It is useful when you want to follow shape anisotropy—the extent to which a shape is directionally uneven—across a path or trajectory.
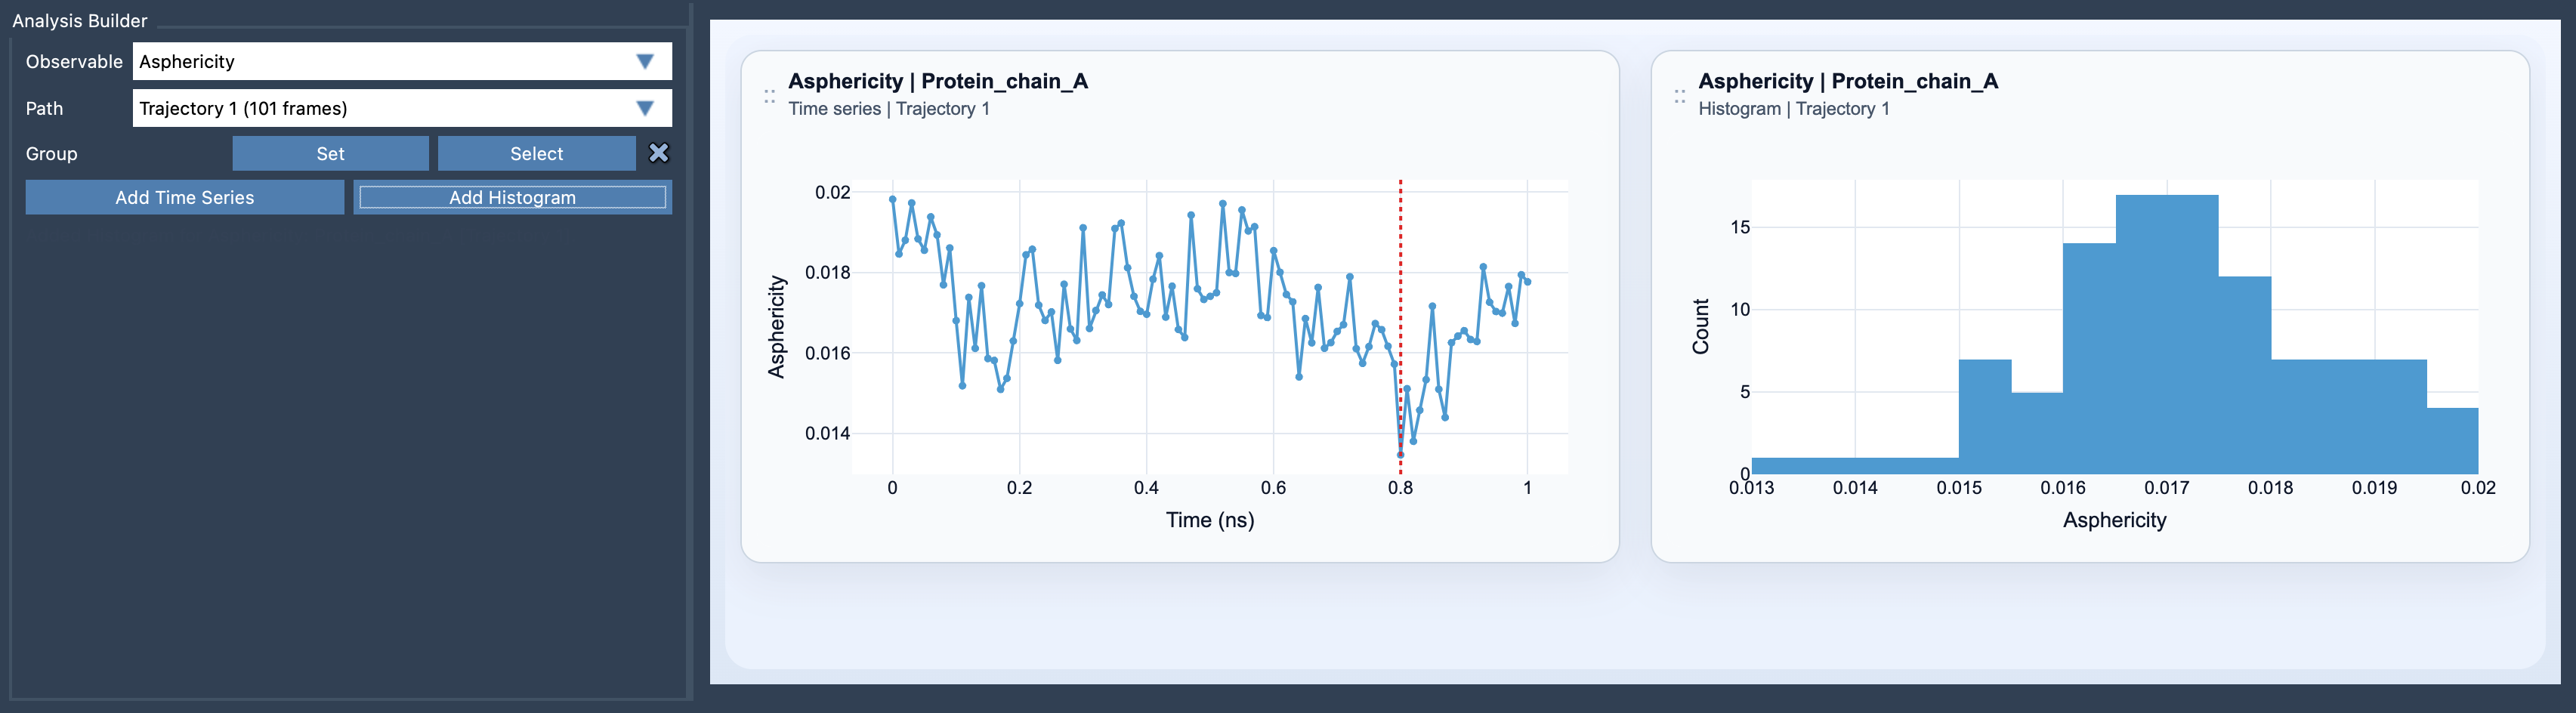
Choose the question before the plot
Before adding an analysis, decide which atoms belong to the structural feature you want to understand. Asphericity is calculated for a selected group, so the selection matters: a group that is too broad can mix together different parts of a system, while a group that is too narrow may not represent the feature you care about. The selection must contain atoms.
It also helps to keep the group definition consistent when comparing changes along a path. Otherwise, a change in the analyzed group could be confused with a change in its shape. Think of the plot as answering a focused question: How does the shape of this particular group vary as the system moves along this path?
Build the analysis in Path Analyzer
- Open Path Analyzer.
- Select Asphericity as the observable.
- Choose the path you want to examine.
- Define the atom-containing group to analyze.
- Add either a Time Series or a Histogram.
A time series is the natural choice when you need to see how the descriptor changes along the path. It can help you locate portions where the group’s shape changes, stays relatively steady, or varies repeatedly. A histogram answers a different question: what range of asphericity values was sampled? It is useful for summarizing the distribution, but it does not show where along the path particular values occurred. Use the view that matches the question rather than treating the two plots as interchangeable.
Put the result in context
Asphericity is most informative when interpreted alongside other shape measurements. Radius of gyration can help describe overall size, while asphericity adds a view of deviation from a spherical shape. If the radius of gyration changes little but asphericity varies, that may point to shape changes that a size-focused measurement alone would not fully describe. This is a reason to compare the plots—not a guarantee that one particular structural event has occurred.
The Shape parameter is another useful companion for a fuller picture of global shape changes. Looking at these observables together can help you distinguish questions about size from questions about shape. Keep in mind that the plots summarize the selected group; they do not replace inspection of the molecular structures themselves. When a feature in a plot catches your attention, use it as a cue to inspect the corresponding part of the path.
A practical checklist
- Is the selected group the one whose shape you want to track?
- Does the selection contain atoms?
- Do you need to know when values change (time series), or the range of values sampled (histogram)?
- Would radius of gyration or Shape parameter help provide complementary context?
Asphericity is especially useful when a size-only description feels too coarse. It gives you another way to follow global shape changes along a path, while keeping the analysis focused on a clearly defined group.
Learn more in the Asphericity documentation.
Note: SAMSON and all SAMSON Extensions are free for non-commercial use. Get SAMSON.