



When a ligand moves through a protein, a molecular viewer can show a great deal at once: atoms, bonds, conformations, and one or more possible paths. That detail is useful, but it can also make a simple question hard to answer: where is this group moving? A center-of-mass pathline offers a compact view of that motion, summarizing a selected set of atoms as a trajectory along a path.
This is especially helpful when comparing ligand unbinding routes or following a larger group through a structural transition. It does not show every atom’s individual trajectory. Instead, it visualizes the motion of the group’s center of mass (COM), making the overall displacement easier to follow without mistaking the summary for atom-by-atom detail.
Start by choosing what the line should represent
A useful pathline begins with two choices in SAMSON: which atoms to summarize, and which path or paths to display. In the Document view, select the atom group and the path or paths you want to inspect. To select multiple nodes, hold Ctrl on Windows or Linux, or Cmd on macOS, while selecting.
These selections matter because SAMSON uses sensible broad defaults: if no atoms are selected, the entire system is used; if no paths are selected, all paths in the document are used. That can be convenient for a quick overview, but it may produce a visualization broader than the question you have in mind. For a ligand-focused view, select the ligand and the specific route you want to examine.
Build a pathline in three steps
- Load a system with paths. The tutorial’s sample contains lactose permease (
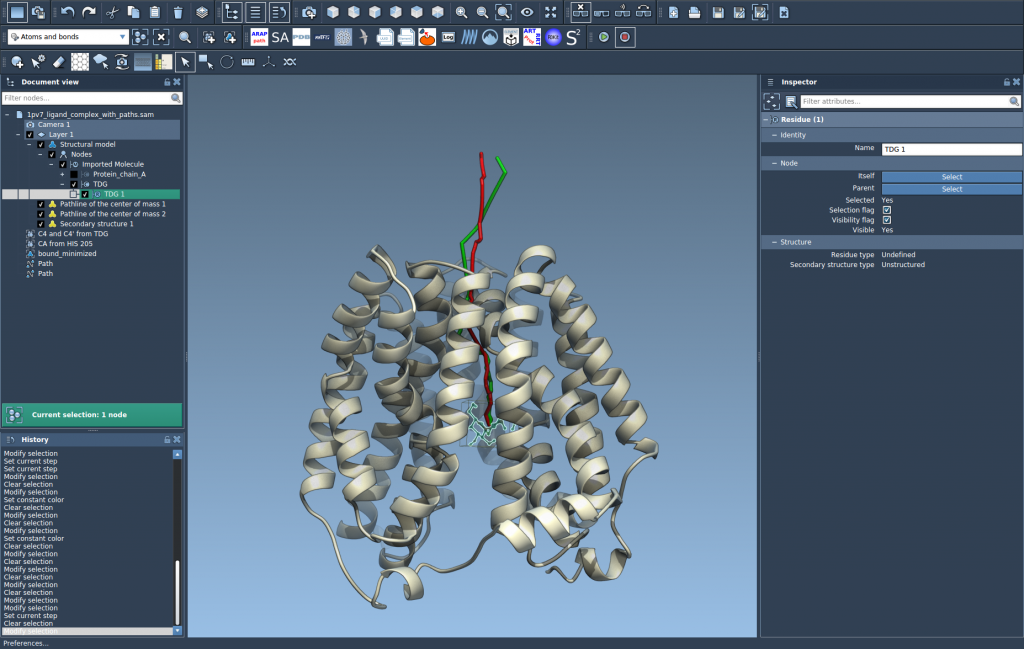
1PV7), the ligand thiodigalactosid (TDG), and unbinding paths. You can download it in SAMSON through Home > Download using the sample document URL shown in the original tutorial. - Select the atoms and paths. In the Document view, choose the group whose collective motion you want to summarize and one or more paths to include.
- Create the visual model. Go to Visualization > Visual model > More…, choose Pathline of the center of mass, and click OK.
The resulting line makes the selected group’s COM motion visible along the chosen path or paths.
Use the visualization to answer a focused question
Pathlines are most useful when you treat them as a focused visual aid rather than a complete description of molecular motion. For example, select a ligand and a route to inspect its overall displacement during unbinding. Or select a group of atoms in a protein and use a pathline to make collective domain movement easier to follow. In reaction-coordinate workflows, the same view can help communicate how a selected group’s COM moves along a path.
Because the pathline represents a center of mass, it can simplify a crowded structural view. But that simplification has a limit: the line describes the group as a whole, not the detailed motion of every atom within it. If your question concerns changes among individual atoms, inspect the structure and relevant atom-level information as well. Choosing a smaller, meaningful atom group can also make the summary more directly relevant to the question.
Explore and adjust the view
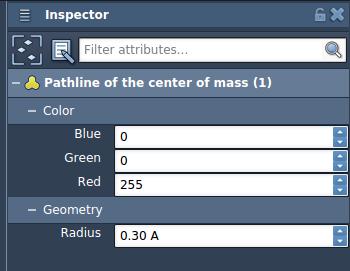
You can double-click a path in the Document view to start or stop it. Right-click a path to find its Path > … context-menu options. To access path controllers, select a path and open the Inspector with Ctrl/Cmd + 2. To change the pathline’s appearance, select the pathline visual model and adjust its color or thickness in the Inspector.
Keep the relationship between the path and its pathline in mind while editing: deleting a path also removes its associated pathline, and deleting atoms used by a pathline modifies the visualization. If the display changes unexpectedly, checking the selected atoms and paths is a practical first step.
For a complete walkthrough, sample download instructions, and related tutorials on computing or exporting paths, see Visualize center-of-mass motion with Pathlines.
Note: SAMSON and all SAMSON Extensions are free for non-commercial use. Get SAMSON.