



A molecular structure can look almost unchanged while one bond rotates enough to alter a side-chain orientation, a backbone state, or the route between two conformations. That makes torsional motion easy to miss if you only compare snapshots. A dihedral analysis turns that motion into an angle you can follow across a path or trajectory.
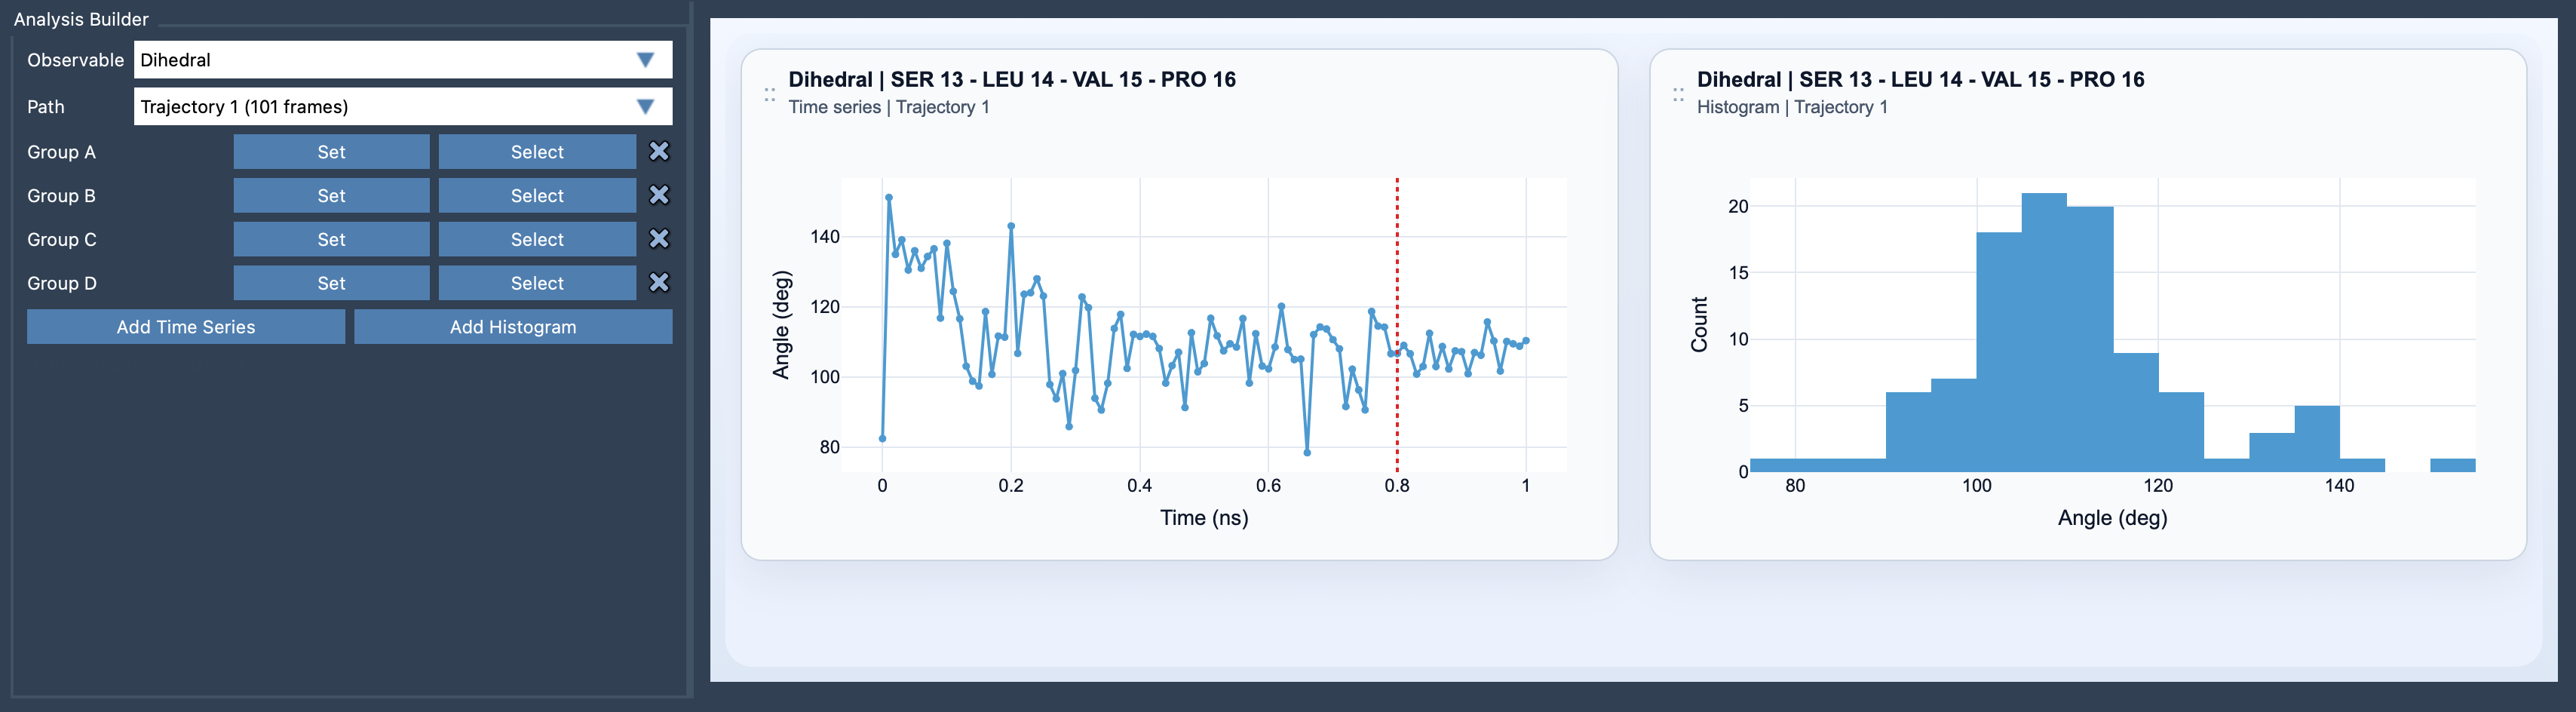
In SAMSON’s Path Analyzer, the Dihedral observable measures a torsion defined by four selected groups. You can view the result as a time series to locate when a rotation happens, or as a histogram to see which angular states are visited more often. These views answer different questions, and choosing the right one can make an analysis much easier to interpret.
First, define what is rotating
The order of the four selections matters: Group A → Group B → Group C → Group D. Groups B and C define the central bond or geometric axis, while A and D provide the points on either side that describe the twist. A useful way to plan the measurement is to identify the central bond or axis first, then choose groups on both sides of it.
Path Analyzer requires all four groups to contain atoms. If a group contains a single atom, its atomic position represents the group. If it contains multiple atoms, the representative position is the group’s center of mass. This detail matters when selecting groups: the value is calculated from four representative positions, not from every atom in the selected groups individually. If your goal is to monitor a particular local torsion, keep the selections tied to that feature rather than making them broader than necessary.
Choose the view that matches your question
Use a time series when you need to know where along a trajectory or path a torsional change occurs. It helps answer questions such as: Does the rotation happen gradually, or is there a sharper transition? At which part of the path does the angle change? The plot can also help you identify intervals worth examining more closely in the molecular structure.
Use a histogram when your first question is about the distribution of torsional states. It gives a compact view of which angles are visited more frequently and can help you spot preferred or metastable conformations. A histogram is useful for recognizing populations, but it does not tell you the order in which states were visited. If transition timing matters, pair it with the time series.
Read the angle in context
The result is reported in degrees. At each point, the calculation uses the positions of the four groups to form three connecting vectors and two plane normals, then evaluates the torsion using an atan2-based expression. In practical terms, the measured angle describes how the planes on either side of the central axis are oriented relative to one another.
Because a torsion is an angular quantity, interpret changes with its periodic nature in mind. A plotted value near one end of an angular scale and a value near the other end may represent neighboring orientations rather than a large physical rotation. When a plot seems to show a sudden jump, inspect the corresponding structures before concluding that the molecule underwent a dramatic movement.
For a fuller picture, compare the dihedral with other observables. Pairing it with RMSD can help relate a local torsional change to overall structural change; pairing it with Energy can help you examine whether the rotation coincides with an energetic change. These comparisons do not replace structural inspection, but they can help you decide which part of a path deserves attention.
A practical workflow
- Open Path Analyzer and select Dihedral as the observable.
- Choose the path you want to analyze.
- Set Groups A, B, C, and D in order, with the central axis between B and C.
- Add a time series to inspect when torsional transitions occur, or a histogram to inspect the distribution of states.
- Check notable features against the structures, and consider comparing with RMSD or Energy for additional context.
This approach is especially helpful when the visual difference between structures is subtle but a specific rotation may explain a conformational change. For the full setup details and equation, see the Dihedral analysis documentation.
Note: SAMSON and all SAMSON Extensions are free for non-commercial use. Get SAMSON.