



A molecular pathway can contain many frames, and a list of energies alone rarely explains what the molecule is doing. A high-energy frame might occur during a transition, while low-energy frames may cluster around a stable-looking region—but how do those energy changes relate to the motion you actually care about?
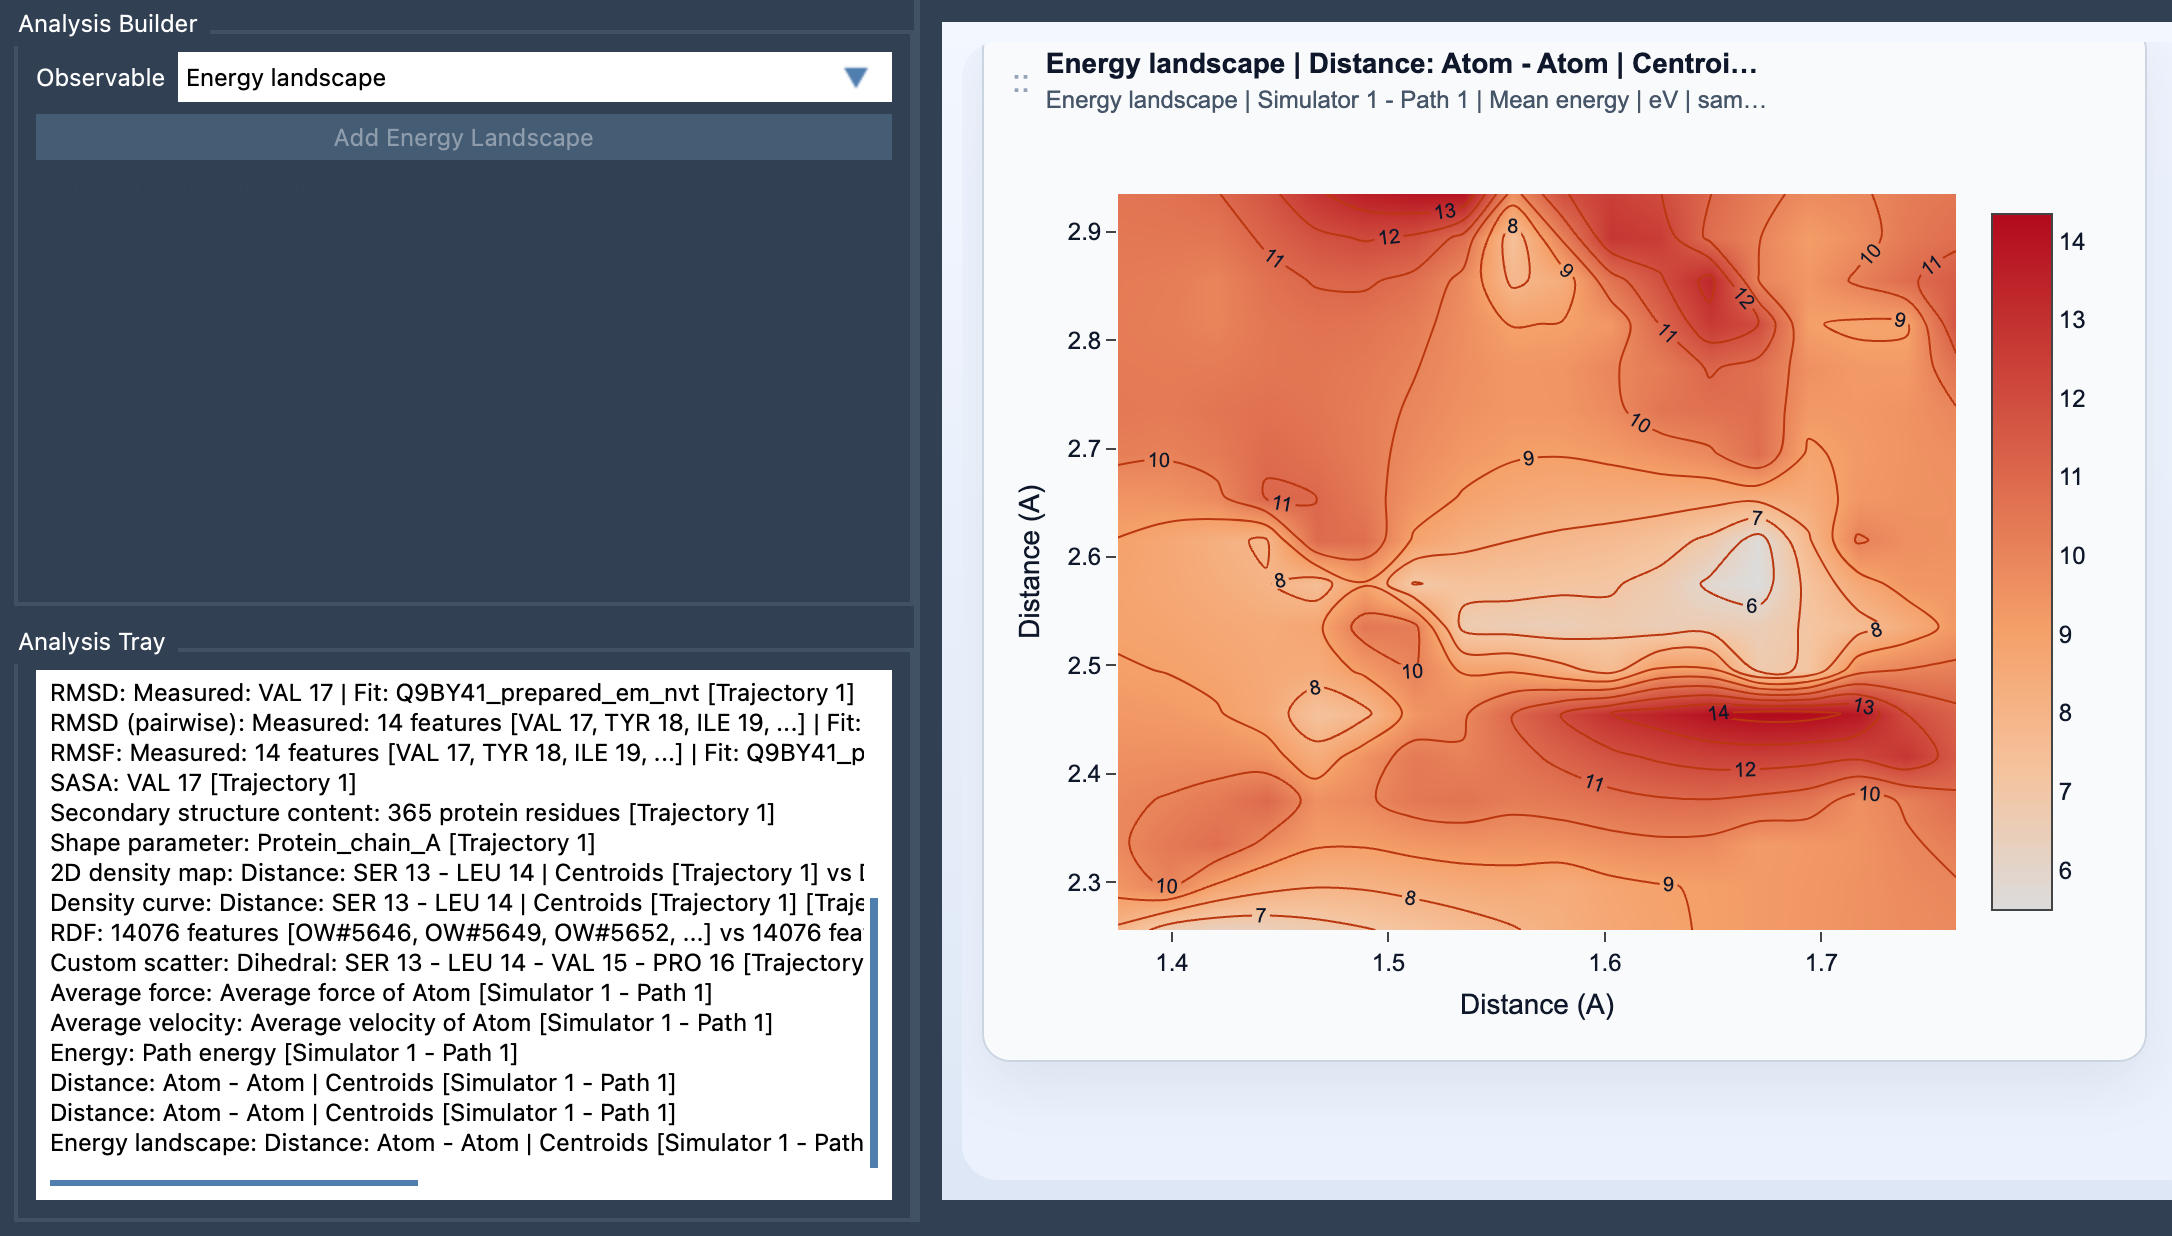
The Energy Landscape view in SAMSON’s Path Analyzer helps answer that question by projecting path energy onto two saved scalar analyses. Instead of viewing energy only against frame number, you can compare it with two observables that describe the motion, such as Distance and RMSD. The result is a contour-style map showing how energy is distributed across that observable space.
Build a useful view from analyses you already have
The plot is a derived analysis: it uses results saved in the Analysis Tray rather than requiring you to make new direct atom selections for the plot. To create one, open Path Analyzer, then create or reuse two saved scalar analyses. Choose Energy landscape as the observable, select exactly two saved analyses in the tray, and click Add Energy Landscape.
There are two important compatibility requirements: both source analyses must be frame-wise scalar analyses computed on the same path, and the path must expose energy data for the frames they cover. If the plot cannot be built, checking these requirements is a sensible first troubleshooting step.
Choose coordinates that make the question visible
The two observables define the map’s axes, so their choice determines what you can see. Start with quantities that help distinguish the motion of interest. For example, Distance and RMSD may make it easier to relate a changing separation to structural deviation. The best pair depends on the scientific question: ask what two measurements would help you tell one part of the pathway from another.
Keep in mind that a two-observable view is a projection of a more complex path. Frames that differ in other structural details can share similar values on the two chosen axes. Treat the map as a way to inspect relationships, not as a complete description of every molecular configuration.
Mean energy or minimum energy?
Each cell, or bin, groups frames whose projected coordinates fall within that part of the observable space. The card lets you display either the Mean energy or the Minimum energy for the frames in each bin.
- Mean energy summarizes the energies of all sampled frames in a bin. It is useful when you want an overall view of the energy values represented there.
- Minimum energy shows the lowest sampled energy in a bin. It highlights the best-energy frame found there, but a minimum by itself does not describe the rest of the frames in that bin.
These are different summaries, not competing answers. If a region looks favorable under the minimum-energy view but less so under the mean, that difference is a reason to inspect the sampled frames and compare the two summaries—not to assume that one tells the whole story.
Separate energy from sampling
An energy landscape is not the same as a map of how frequently the pathway visits each region. The energy view summarizes energy values in bins; it does not, by itself, tell you how densely the path sampled them. When that distinction matters, compare the result with a 2D density map. A Custom scatter plot can also help you examine the relationship between observables and energy trends.
After creating the card, you can adjust its color scale, show or hide contour lines, change their color, and select the energy unit. These display choices can make patterns easier to inspect, but they do not change the underlying fact that the map is a projection based on two chosen observables.
Use the view to ask focused questions: Where do lower-energy regions lie in the coordinates I chose? Does the energy change along the part of the path I care about? Do the mean and minimum summaries tell a similar story? Pairing those questions with a sampling-density view helps keep energy trends and frame distribution distinct.
For the complete workflow and details, see the Energy Landscape documentation.
Note: SAMSON and all SAMSON Extensions are free for non-commercial use. Get SAMSON.