



A molecular structure can look dramatically different in a viewer while its overall compactness changes only a little. The reverse can happen too: a modest-looking movement may correspond to a meaningful expansion or collapse. When you need a simple way to track this global change across a path or trajectory, radius of gyration offers a useful starting point.
Think of radius of gyration as a measure of how spread out the selected group is around its center. A smaller value generally means the group is more compact; a larger value indicates that its atoms are, overall, more spread out. It does not tell you exactly which part moved or whether a structure is biologically meaningful. Its strength is that it reduces a complicated shape to one readable quantity, reported in ångströms (Å).
Start with a question, not just a curve
Before plotting, decide what you want to learn. Are you checking whether a selected region expands during a conformational change? Comparing how compact a group is at different portions of a path? Looking for a broad range of compactness values that occurs repeatedly? The question helps determine both the group to analyze and the view that will be most useful.
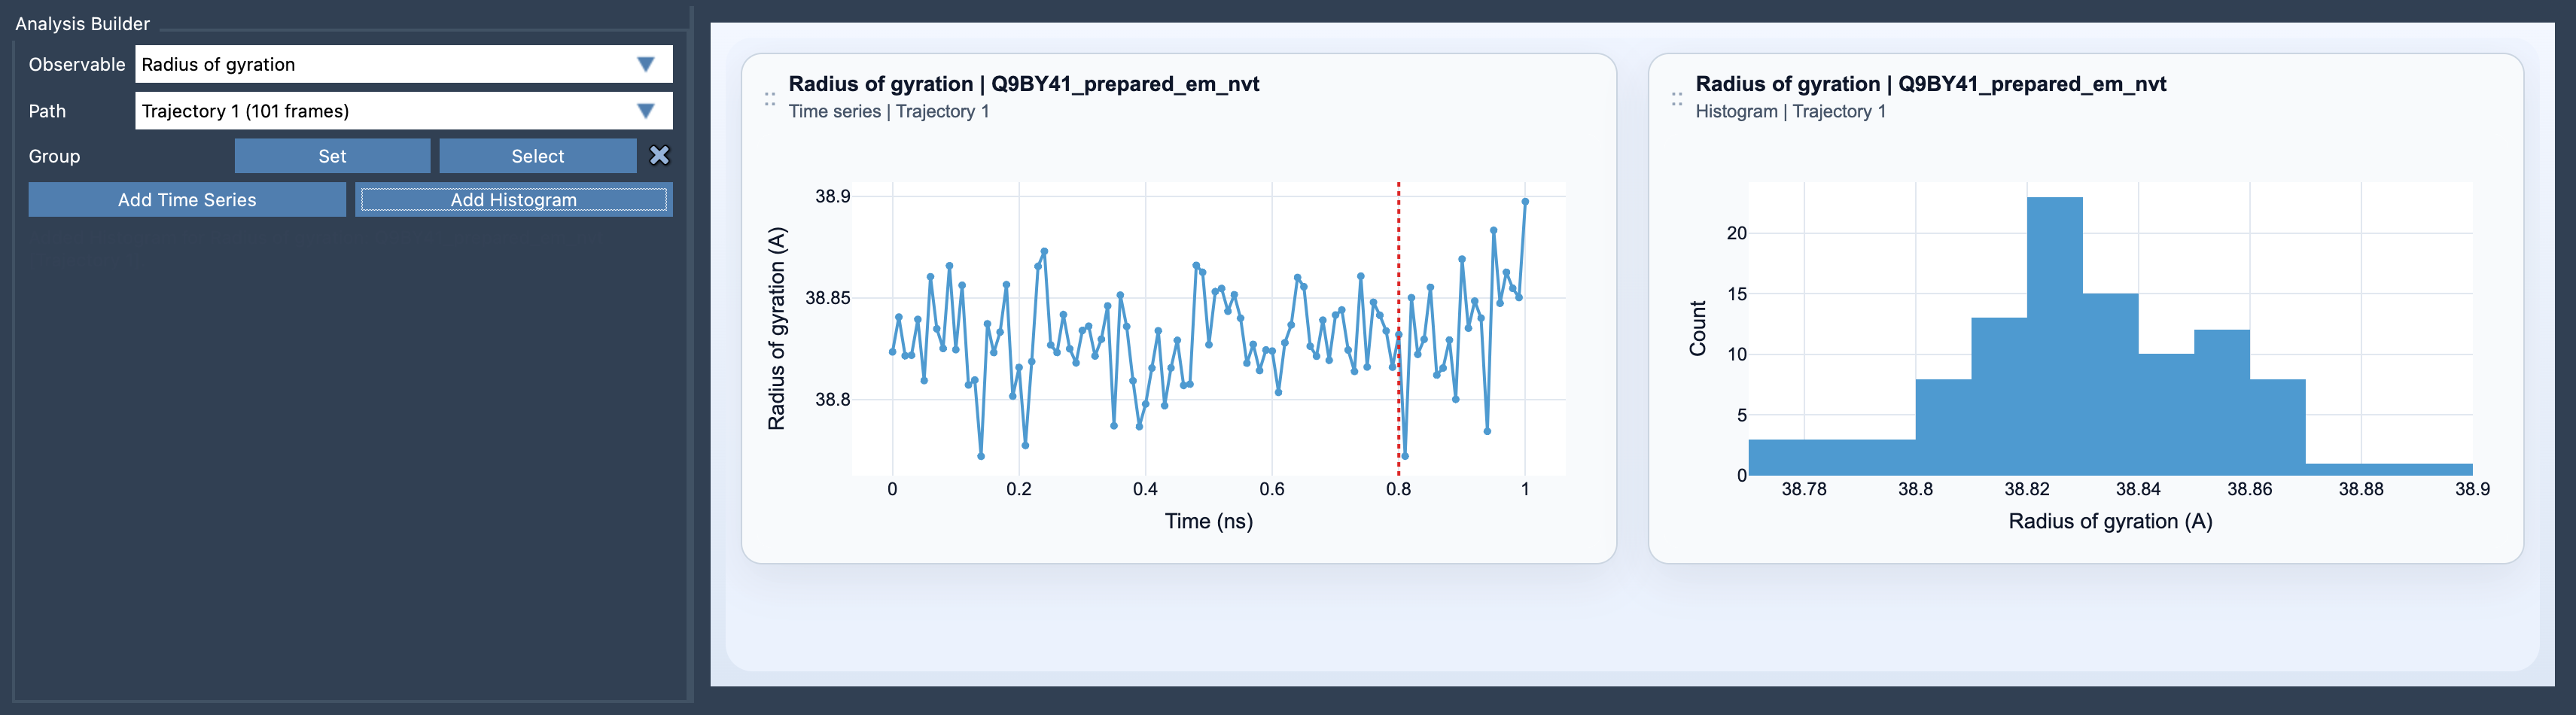
In SAMSON, open Path Analyzer, select Radius of gyration as the observable, choose a path, and define the group. The group must contain atoms. Then choose Add Time Series to follow compactness along the path, or Add Histogram to inspect the range of values represented in the data.
Choose the group carefully
The selection determines what the number describes. If you select an entire assembly, local changes in one domain may be diluted by the rest of the structure. If you select only a small region, the result describes that region—not the whole molecule. Make the selection match the biological or modeling question, and keep it consistent when comparing paths or runs. Otherwise, a difference in the plotted values might reflect a difference in what was measured rather than a difference in molecular behavior.
Read changes as clues, not verdicts
In a time series, a sustained rise can point to expansion of the selected group, while a sustained fall can indicate compaction. A short-lived spike may be worth inspecting in the structure, but the radius-of-gyration plot alone cannot identify its cause. It is a global summary, not a map of atom-by-atom motion, and it does not by itself establish that a molecule has folded correctly or reached a stable state.
A histogram answers a different question. It shows which compactness values are represented across the path, but it does not preserve their order. Two paths can have similar histograms even if their values occur in a different sequence. Use the time series when the progression matters; use the histogram when the distribution of compactness values is the focus.
Add shape context when needed
Compactness is only one part of shape. Two structures can have similar radii of gyration and still differ in how elongated or unevenly distributed they are. If that distinction matters, compare the result with Asphericity or Shape parameter. These complementary observables can help distinguish a change in overall spread from a change in the character of the shape.
For a quick first pass, radius of gyration is especially useful: choose a clearly defined atom-containing group, plot it along the path, and treat changes as prompts for closer inspection—not conclusions on their own.
Learn more in the Radius of Gyration documentation.
Note: SAMSON and all SAMSON Extensions are free for non-commercial use. Get SAMSON.