



A protein trajectory or conformational path can look smooth in 3D and still contain a local backbone change that is difficult to spot by eye. The reverse can happen too: a loop may move visibly while keeping similar backbone geometry. A Ramachandran plot helps separate these questions by showing backbone conformations as points in phi/psi space.
This is useful when you need to locate conformational outliers, inspect a loop or active site, or understand where a backbone changes along a path. Rather than relying only on the overall shape of the protein, you can focus on the angular states of selected residues and connect a plotted point back to the corresponding path frame.
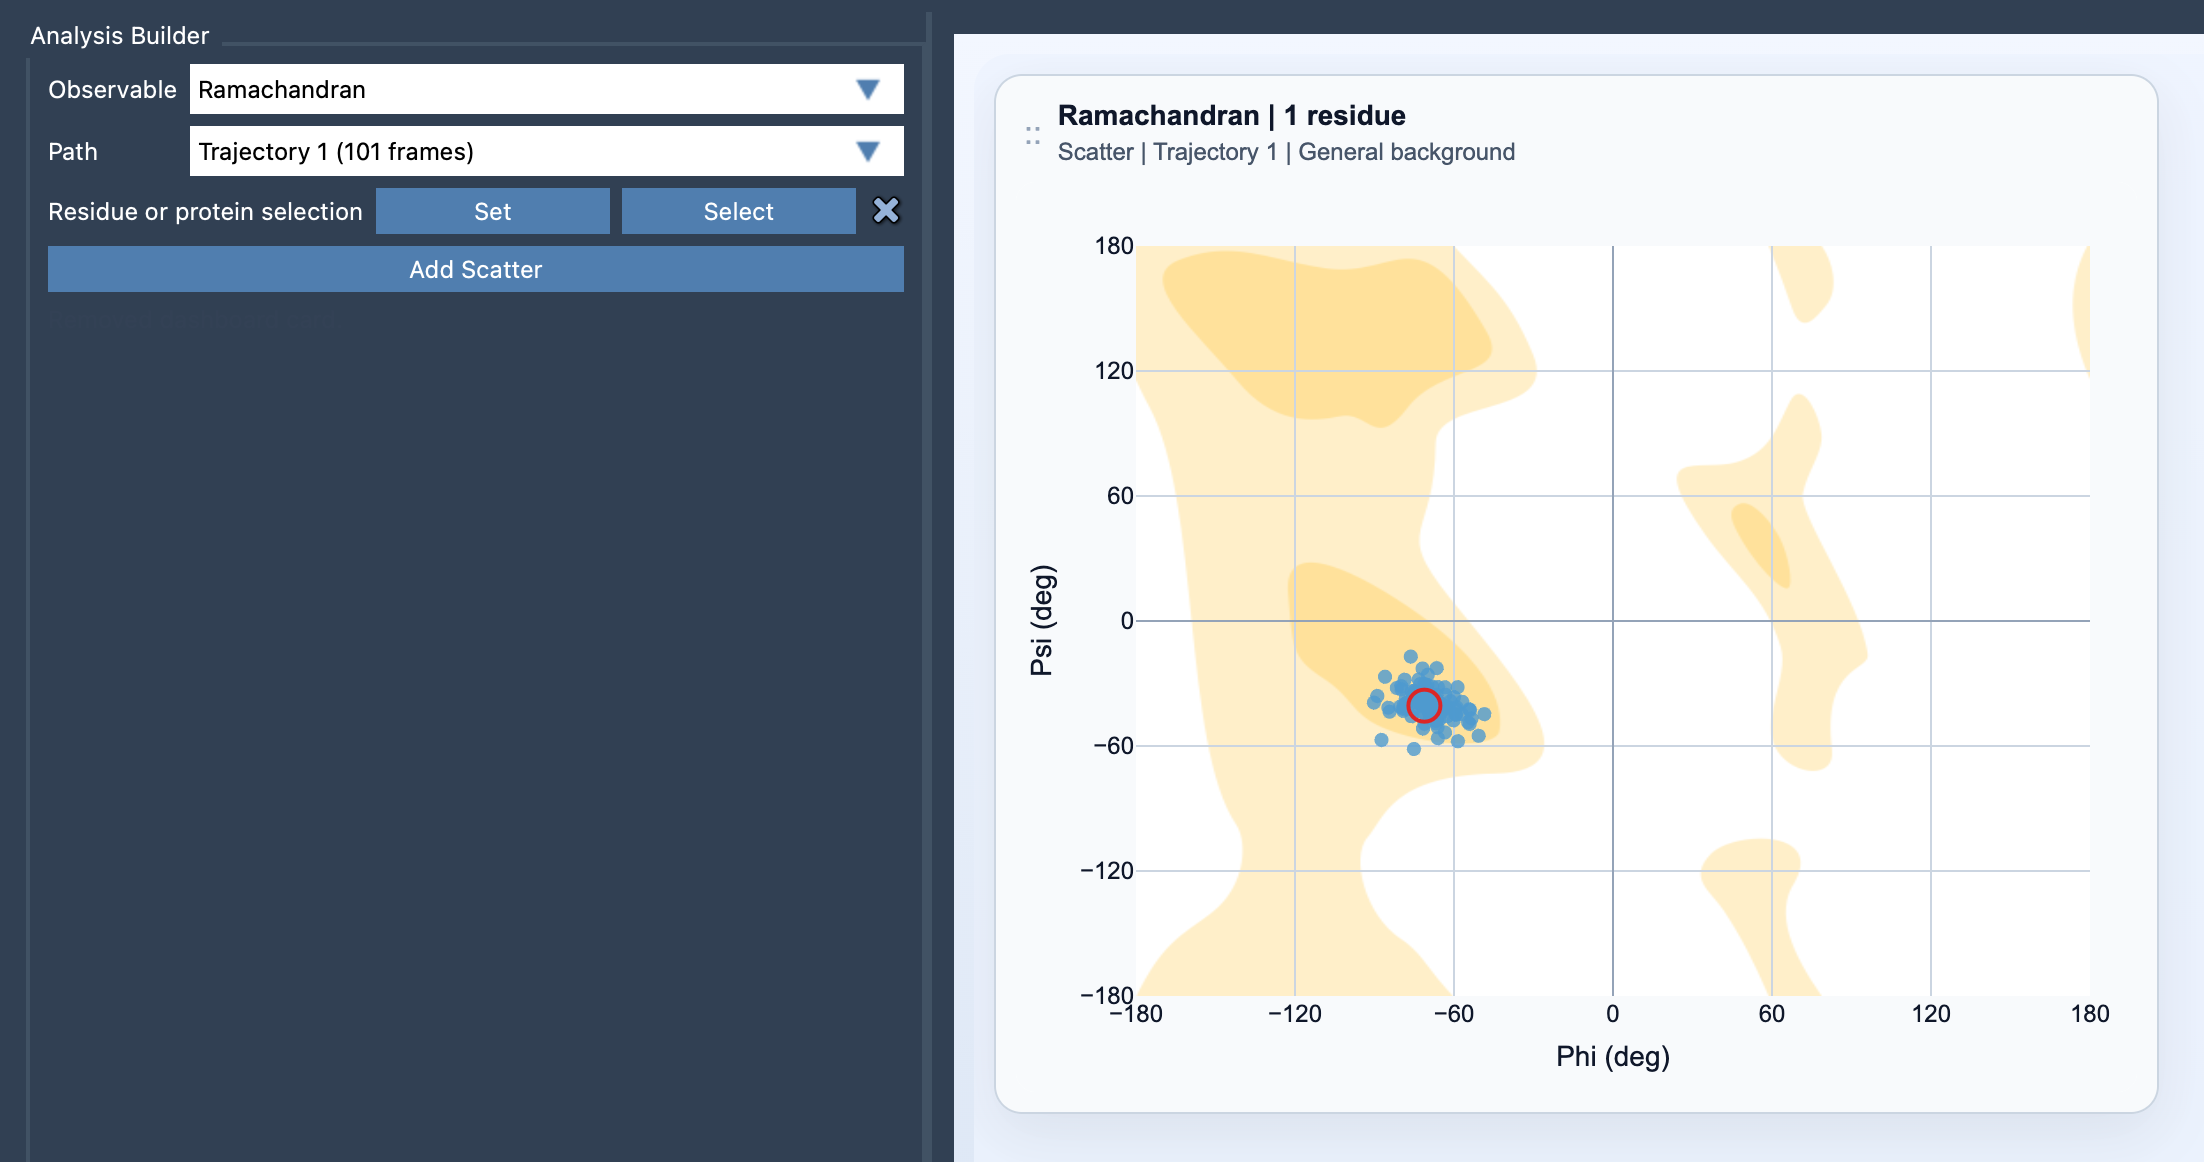
What the plot tells you
For each valid selected protein residue, the analysis plots phi on the horizontal axis and psi on the vertical axis. These backbone torsion angles describe rotations around bonds in the protein backbone. Together, they provide a compact way to compare backbone conformations: points in different parts of the plot represent different combinations of phi and psi.
When the analysis is applied to a path, each valid residue contributes phi/psi points across that path. This makes the plot useful not only for asking “What conformation is this residue in?” but also “How does its conformation vary as I move through the path?” The plot complements a 3D view: it describes backbone angles, while the molecular view shows the structure in space.
A practical way to investigate a suspicious region
- Open Path Analyzer.
- Choose Ramachandran as the observable and select the path you want to inspect.
- Define a residue or protein selection, then click Add Scatter.
- Start with a focused selection if you have a specific loop, motif, or active site in mind. A broader selection is useful when you want a global view of conformational sampling.
- Click a point to move the path to its corresponding frame. Double-click a point to select its residue in SAMSON.
That point-to-frame connection is especially helpful when a plot reveals a change you want to examine structurally. Move to the relevant frame, select the residue, and inspect its local environment in the molecular scene. This turns the plot from a summary into a way to navigate the path.
Keep the selection and interpretation in view
The selection must contain atoms belonging to protein residues. If the plot seems incomplete, first check that the selection contains the residues you intended to analyze. A focused selection can make a local transition easier to follow; a broad selection can reveal how many parts of a protein vary, but may be harder to interpret at once.
Also remember what the plot represents: backbone angles across the chosen path. A plotted point alone does not explain why a conformation occurs or establish whether it is biologically meaningful. Use it to identify a frame or residue worth investigating, then consider the structure and other measurements. The documentation specifically recommends pairing Ramachandran points with secondary structure content and RMSD for complementary views.
Path Analyzer chooses a suitable plot background automatically, and you can change it later in the card settings. This lets you begin with the analysis without first having to configure the background.
For setup details, see the Ramachandran reference documentation.
Note: SAMSON and all SAMSON Extensions are free for non-commercial use. Get SAMSON.