



A molecular structure can contain a lot of useful information—and be difficult to explain. When you are checking a ligand-binding pose or preparing a figure for collaborators, it is not always easy to see which contacts matter, which residues are nearby, and how to present the result without a cluttered 3D view. A 2D interaction diagram can help turn that structural context into something easier to inspect and discuss.
In SAMSON, the Interaction Designer creates a diagram from the current selection, or from the whole document if nothing is selected. Choose Home > Diagram to generate one. The diagram is connected to the 3D viewport: selecting an atom or structure in the diagram selects it in 3D, and double-clicking zooms in on it. This makes the diagram useful not just as a figure, but as a way to move between a summarized view and the underlying structure.

Make the diagram answer a question
Before adjusting the layout, decide what you want the viewer to notice. Are you checking a particular ligand contact? Comparing nearby residues? Looking for solvent-accessible parts of the ligand? The Interaction Designer can show the binding pocket for protein–ligand interactions, solvent accessibility of ligand atoms, and detected interacting residues or structural groups. These views help focus attention, but the diagram is most useful when you treat it as a guide to the structure rather than as a complete explanation of binding.
That distinction matters: a detected contact means that the atoms or groups meet the implemented geometric criteria. It does not prove that the interaction stabilizes the complex or provide an interaction energy. For example, a hydrogen bond is identified using donor/acceptor categories and distance criteria, with an angle criterion when explicit hydrogens are present. Other detected categories include ionic interactions, metal coordination, aromatic contacts, and several atom–plane or group–group contacts. Interpret these as geometrical observations that can help you inspect a model—not as a verdict on its quality.
Reduce visual clutter without hiding the science
Interaction diagrams are editable. Move labels and interaction symbols to separate overlapping annotations and make the main relationships easier to follow. If a category distracts from the point you are making, click its name or icon in the caption or legend to hide it; click again to show it. Double-click a category in the legend to change its color. If you want to return to the default colors, use the Interaction Designer settings available from its window title bar.
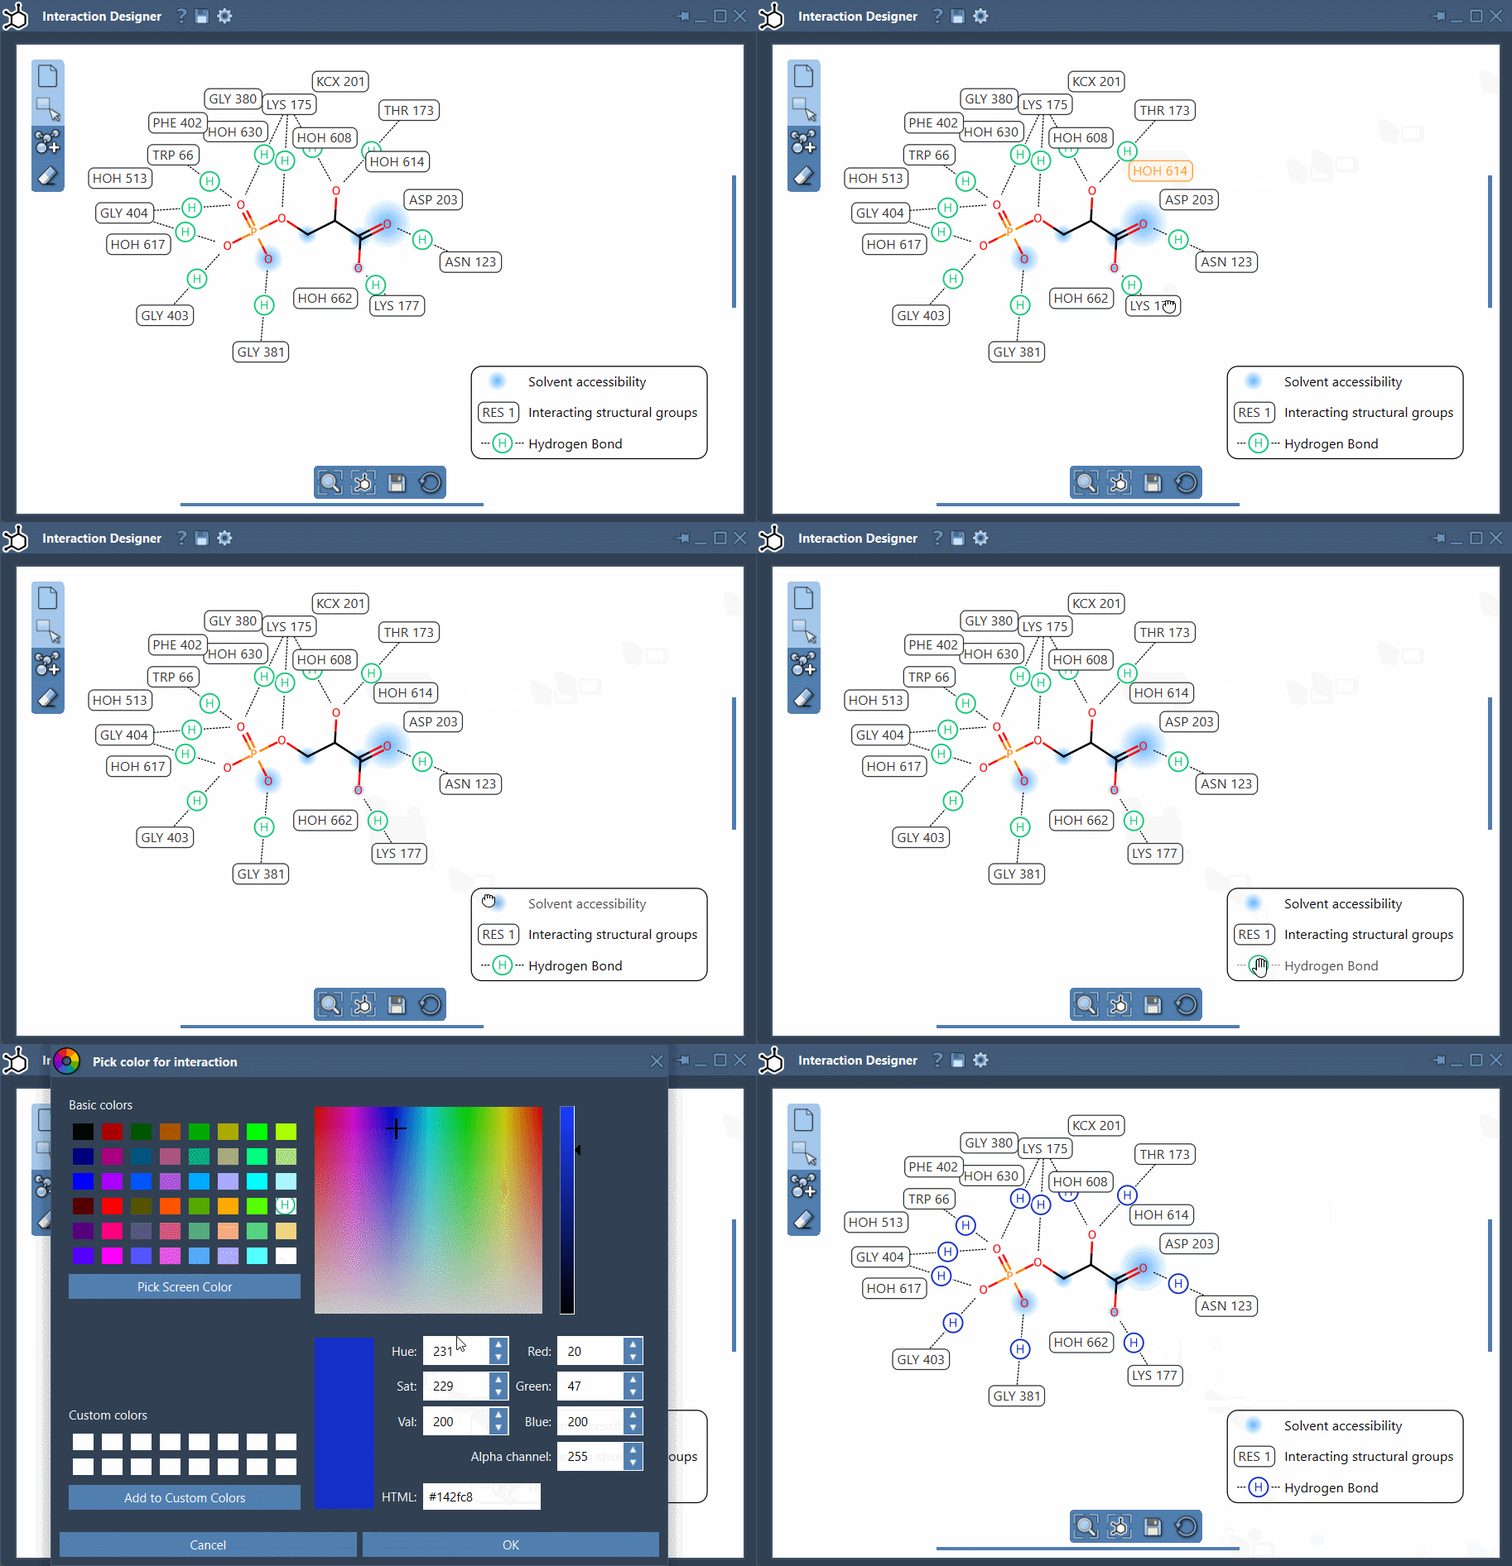
A useful rule for preparing a clear figure is to make one change at a time: first arrange the labels, then decide which interaction categories need to be visible, and finally adjust colors if they improve readability. Keep the legend understandable so that someone seeing the diagram for the first time can tell what the symbols represent. Use the bottom menu to update the view and align the 2D and 3D views. To zoom, hold Ctrl (or Cmd on macOS) while scrolling; to translate the diagram, hold the middle and right mouse buttons while moving the mouse.
Keep the 2D view connected to the model
The connection to 3D is especially helpful when a label or contact raises a question. Select the relevant item in the diagram and inspect its position in the viewport instead of relying on the 2D depiction alone. Selection, addition, and removal of atoms and fragments are synchronized between the 2D document and the 3D viewport. This also means that edits made while designing a molecule in 2D remain tied to the molecular document.
When the diagram or sketch is ready to share, use Save in the bottom panel. The Interaction Designer can export diagrams and 2D molecule drawings in PNG, JPG, JPEG, BMP, and SVG formats. Choose a raster format for a straightforward image, or SVG when a scalable vector graphic is more suitable for your workflow.
A concise interaction diagram can make a molecular model easier to discuss, while the linked 3D view and geometric criteria keep the interpretation grounded in the structure. For the full workflow and details on supported contact categories, see the Interaction Designer documentation.
Note: SAMSON and all SAMSON Extensions are free for non-commercial use. Get SAMSON.