



A protein structure can look plausible in a 3D viewer and still contain local backbone conformations worth a closer look. This is a common modeling frustration: visual inspection may not make it obvious which residues are strained, or where to focus refinement. A Ramachandran plot provides a useful way to inspect this local geometry by showing each residue’s backbone dihedral angles, φ (phi) and ψ (psi).
The plot is not a verdict on the whole structure. It is a focused view of backbone conformations: a way to identify residues whose angles fall in energetically unfavorable regions, select them in the 3D structure, and explore how changing their angles affects the model.
Read the plot before editing
In SAMSON, the Interactive Ramachandran Plot displays ψ against φ. Yellow regions mark energetically favorable areas, while white regions mark unfavorable conformations. Each residue appears as a point. The plot also offers tabs for All, General, Glycine, Proline, and Pre-proline residues. These categories let you inspect residues in relevant groups rather than assuming one view fits every residue type.
To follow along, open a protein structure in SAMSON. The tutorial uses PDB ID 1YRF, which you can load from Home > Fetch. Then open Home > Apps > Biology > Ramachandran plot and click Update to generate the plot.
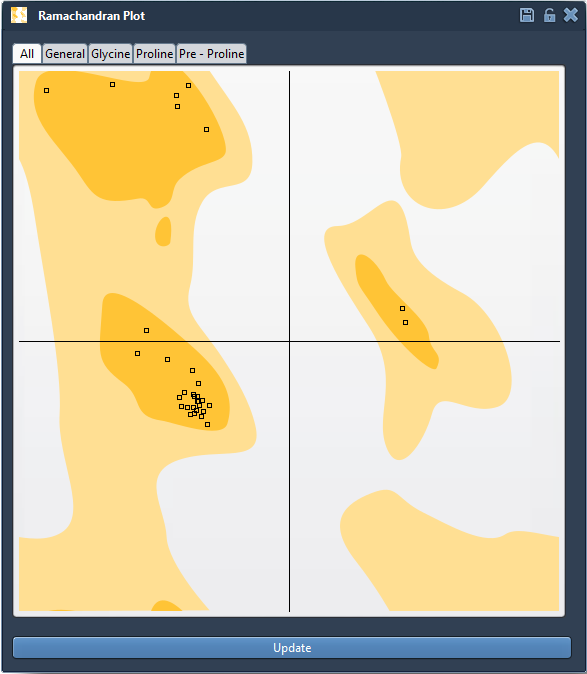
Turn an outlier into a model you can inspect
Click a point to select its residue in the 3D viewport. SAMSON also displays the residue’s φ and ψ values in the status bar. This connection between the plot and the structure matters: instead of trying to locate a potentially strained residue by eye, you can move from its plotted position to the corresponding part of the protein.
Once you have identified a residue to examine, you can edit its conformation in either of two ways:
- Drag its point on the plot. The dihedral angles change as you move the point, and the 3D structure updates in real time.
- Use the Twister editor. Select Twister from the left-hand menu in the viewport and manipulate the protein in 3D while watching the plot update.
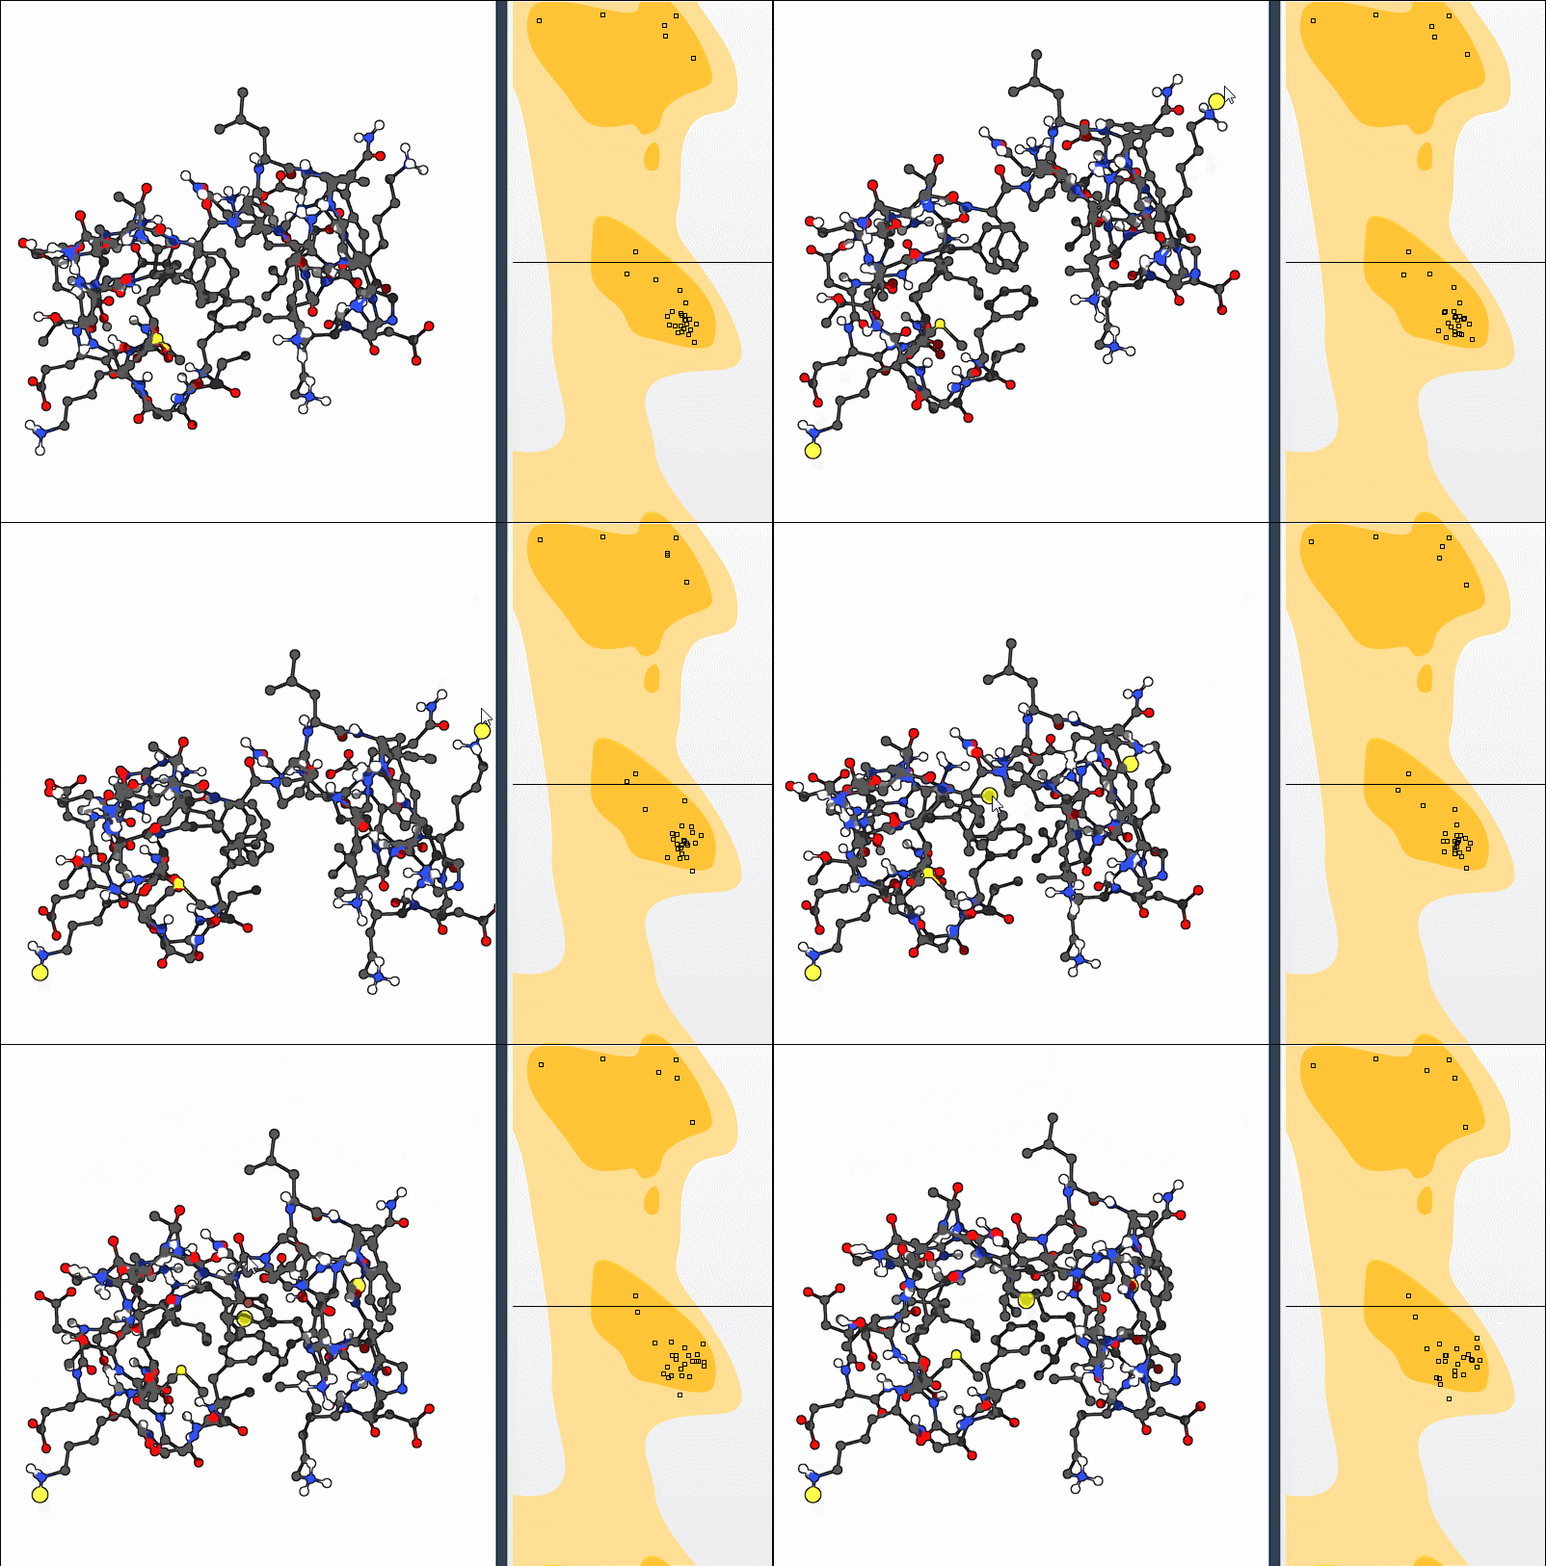
A practical approach is to make one change at a time, then check both views: did the point move toward a favorable region, and does the resulting 3D conformation still make sense in context? If an edit is unsatisfactory, use Ctrl+Z on Windows/Linux or Cmd+Z on macOS to undo it. The plot helps you inspect and adjust local backbone geometry; it does not, by itself, establish that the entire protein structure is correct.
Why this helps in modeling workflows
Checking backbone angles can help you spot strained residues before simulation, review outliers in homology models, and examine conformational flexibility near active or binding sites. It is also useful after broader structural changes: for example, the tutorial’s bonus exercise combines nonlinear normal modes with Ramachandran-plot editing, using global motion as a starting point and then adjusting local conformations.
The key benefit is a clearer path from observation to action: find a residue in the plot, locate it in the 3D structure, adjust its conformation, and inspect the result. For setup details and the complete walkthrough, see the original Ramachandran Plot tutorial.
Note: SAMSON and all SAMSON Extensions are free for non-commercial use. Get SAMSON.