



A molecular group can keep roughly the same overall size while changing from compact to elongated—or back again. If you track only a size-related measurement, that shape change may be easy to miss. This is the problem asphericity helps address: it reports how far a selected group deviates from a spherical shape along a path or trajectory.
That distinction matters when you are trying to understand a structural transition. Did the group mainly expand or contract, or did its shape become more directional? Asphericity gives you a way to follow the second question without reducing the description to a single distance. It is a shape descriptor, not a complete explanation of why a molecule moved or what caused the change.
Choose the group before interpreting the plot
The analysis depends on the atoms you select. A group that is too broad may combine regions with different motions; one that is too narrow may describe only a local part of the structure. Start with the molecular region relevant to your question, and make sure the selection contains atoms. Then use the same meaningful group when comparing the shape descriptor across the path.
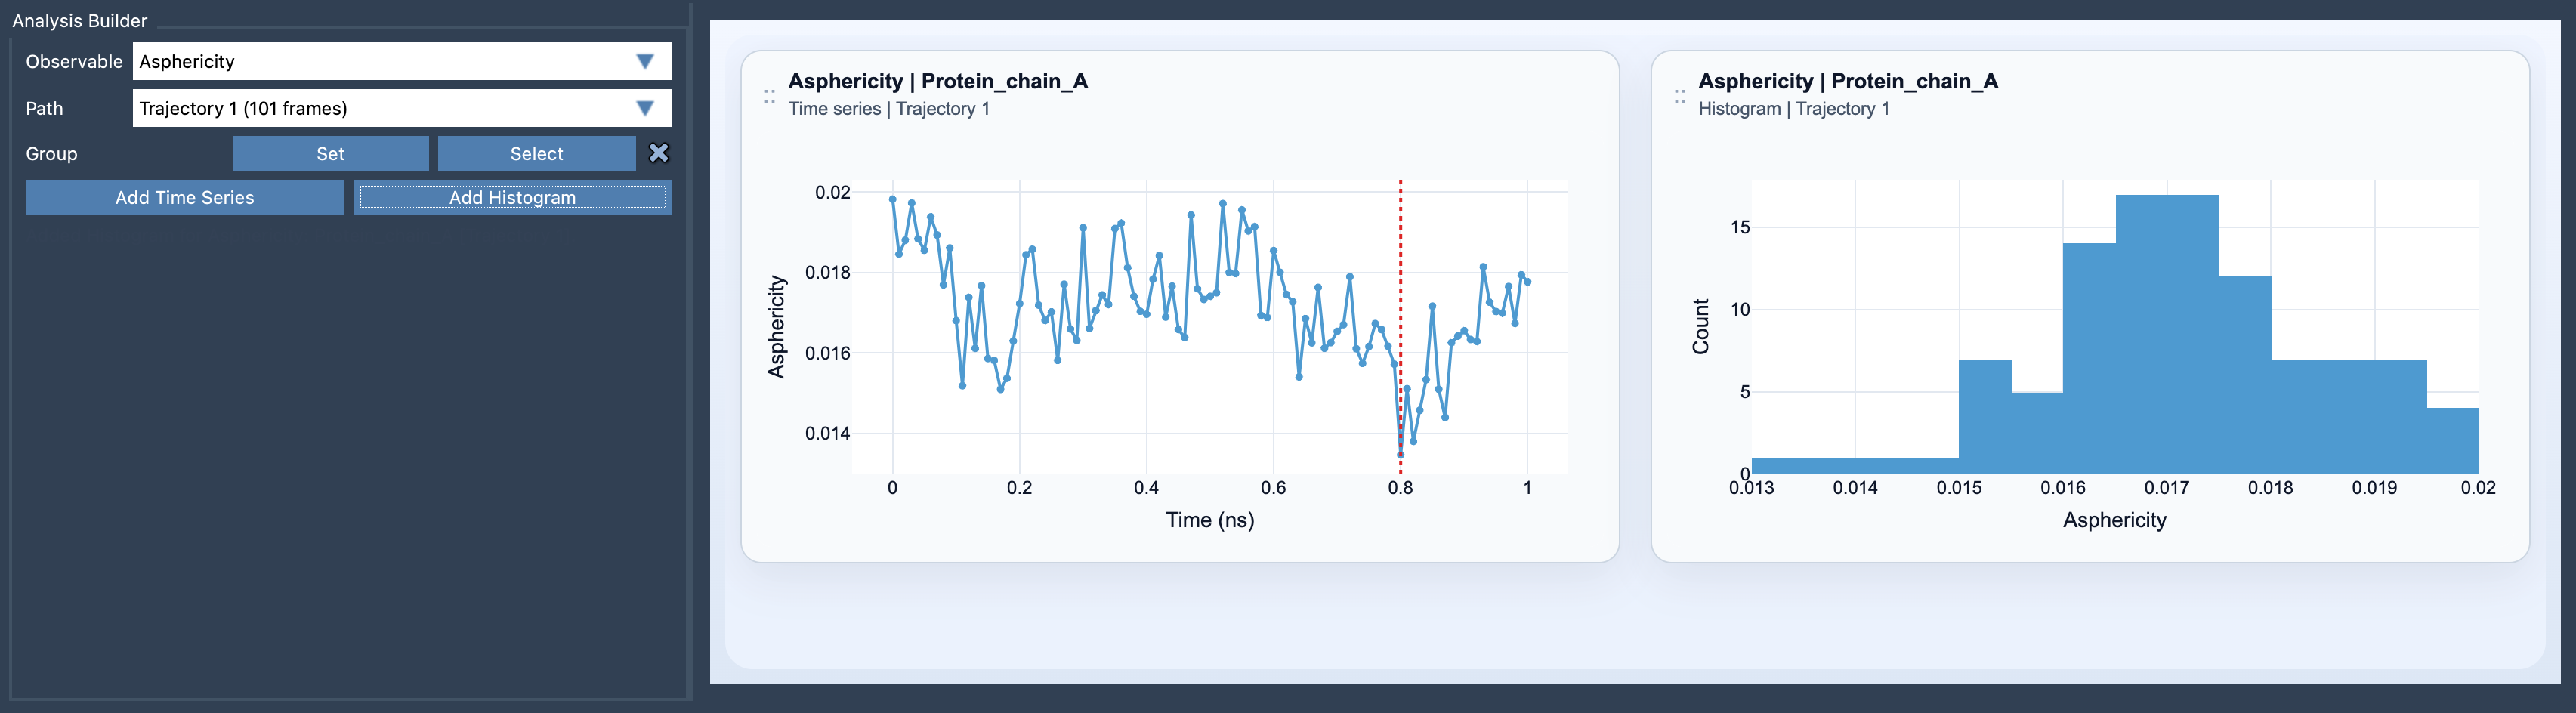
In SAMSON, open Path Analyzer, choose Asphericity as the observable, select a path, and define the group to analyze. Add a time series to follow the descriptor along the path, or add a histogram to inspect the range of sampled values.
Two views, two useful questions
- Time series: How does the shape descriptor vary as the structure proceeds along the path? This view can help you locate regions where the descriptor changes, remains comparatively steady, or varies repeatedly.
- Histogram: What range of values appears across the sampled path? This view is useful for seeing the overall spread, although it does not show where along the path a particular value occurred.
These views complement one another. A histogram can summarize the sampled values, while the time series preserves their order along the path. If the order matters to your interpretation, do not rely on the histogram alone.
Read shape together with size
Asphericity is especially useful when radius of gyration alone feels too coarse. Radius of gyration can help you track a group’s overall spread, while asphericity focuses on deviation from a spherical shape. Looking at both can help distinguish a change in overall spread from a change in shape anisotropy. The Path Analyzer documentation also recommends pairing asphericity with the Radius of gyration and Shape parameter analyses for a fuller picture of global shape changes.
A practical review might go like this: first inspect the asphericity time series for intervals of change; then compare those intervals with the radius-of-gyration plot; finally, consult the shape parameter as an additional descriptor. If the plots do not tell a consistent story, revisit the selected group and the path before drawing conclusions. The measurements describe the chosen atoms along the chosen path, so the selection and context are part of the interpretation.
Keep the conclusion proportional to the measurement
Use asphericity to identify and describe changes in shape, not to assign a biological cause by itself. A plotted change tells you that the selected group’s shape descriptor varies along the path; interpreting why requires the structural and scientific context of your model. Pairing complementary descriptors can make that interpretation more informative, but it does not remove the need to inspect the system and the path you analyzed.
For setup details, see the Asphericity documentation.
Note: SAMSON and all SAMSON Extensions are free for non-commercial use. Get SAMSON.