



A molecular group can change its overall shape without changing much in size. That can make a trajectory harder to interpret: a single measure such as radius of gyration may look nearly steady, even while the group becomes more elongated or otherwise less sphere-like. If you are trying to understand a conformational transition, size alone may not tell the whole story.
Asphericity offers another view. In SAMSON’s Path Analyzer, it reports how far a selected group deviates from a spherical shape along a path or trajectory. The useful distinction is simple: radius of gyration helps track overall spread, while asphericity helps track shape anisotropy. They describe related but different aspects of the structure.
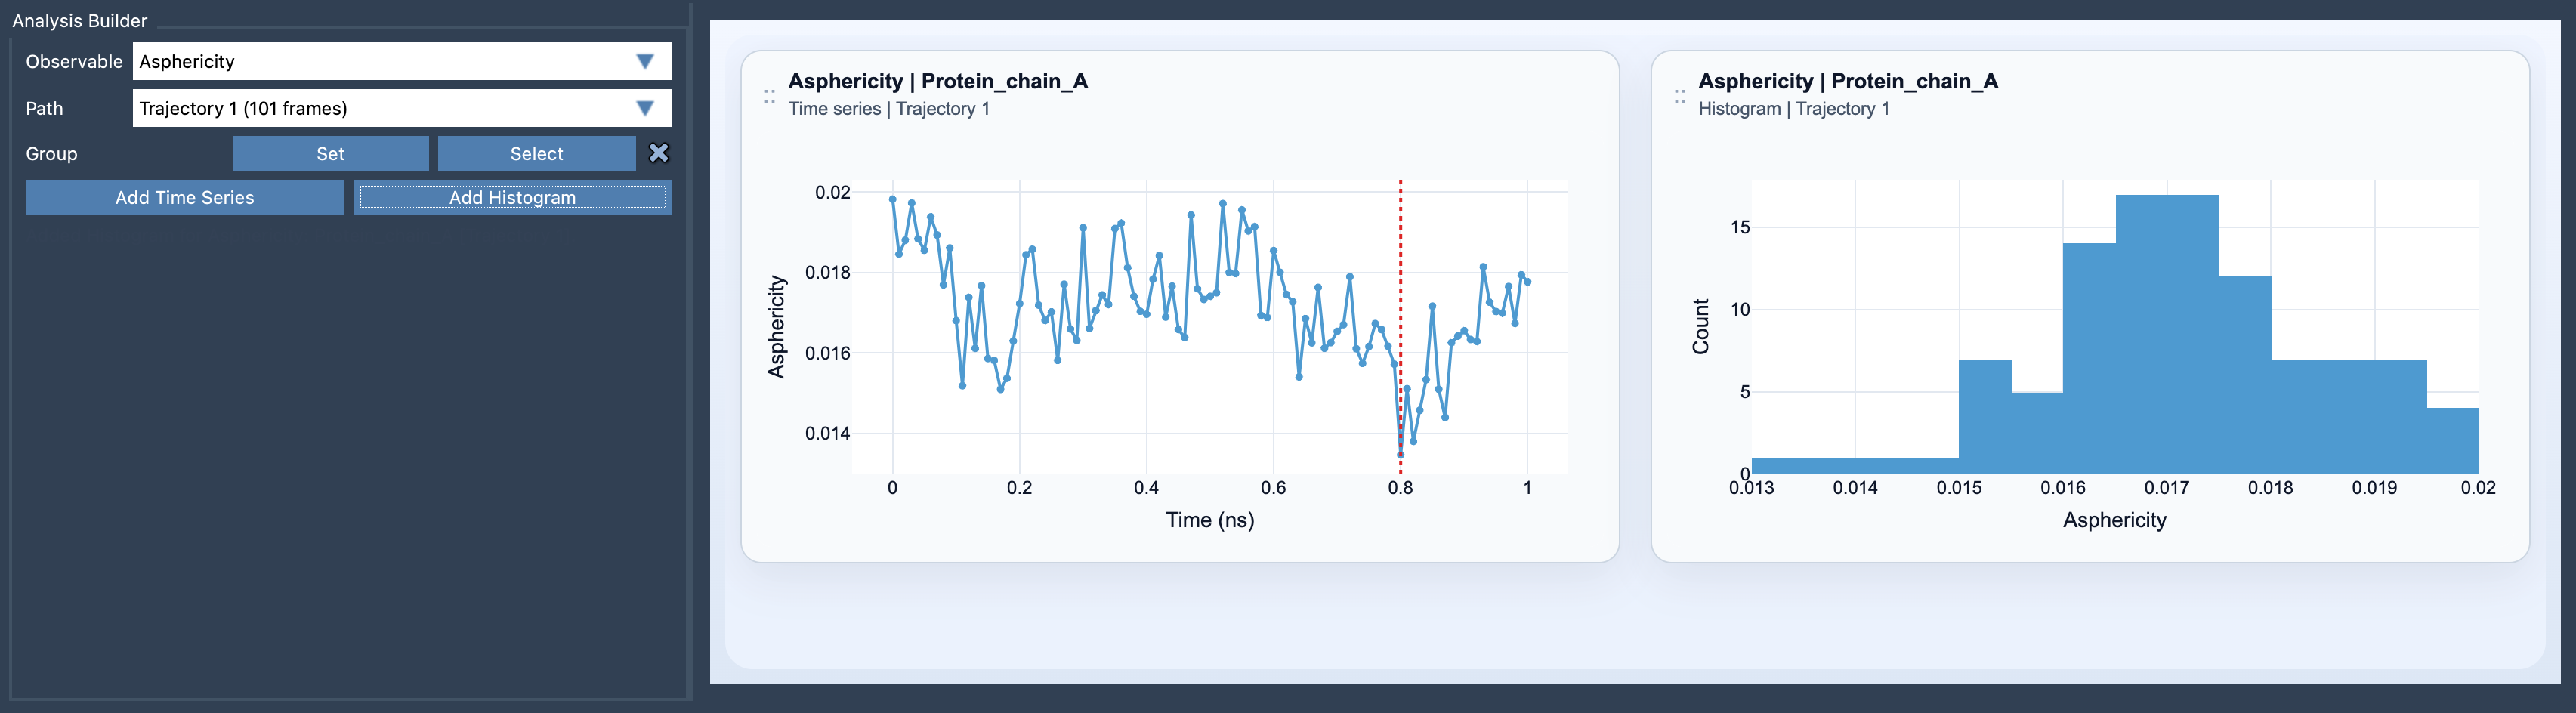
Ask a more useful question of the trajectory
Instead of asking only, “Does this group get larger or smaller?”, you can also ask, “Does its shape become less spherical, and when?” That second question can help when comparing conformations, following a structural change, or checking whether an apparent size change is accompanied by a change in shape.
Asphericity is a descriptor, not a complete explanation of molecular behavior. A changing value tells you that the group’s shape descriptor varies along the sampled path; it does not, by itself, identify the structural event responsible. Use it as a cue to inspect the relevant frames and compare with other observables rather than as a standalone verdict.
Set up the analysis
- Open Path Analyzer.
- Select Asphericity as the observable.
- Choose the path or trajectory you want to inspect.
- Define the group to analyze. The input must be one atom-containing selection.
- Choose Add Time Series or Add Histogram, depending on the question you want to answer.
A time series is the more direct choice when you want to locate changes along the path. It lets you follow the descriptor across the trajectory and relate changes to particular portions of the sampled motion. A histogram instead summarizes the range of sampled values. It can help you see whether the path visits a narrow or broad range, but it does not show when a value occurred. These views answer different questions, so choose based on whether timing or distribution matters most.
Read it alongside size
For a fuller picture, compare asphericity with radius of gyration and shape parameter. Looking at several shape-related observables can help distinguish a change in overall spread from a change in shape. For example, if radius of gyration appears relatively steady while asphericity varies, that is a reason to inspect the structures more closely: the group’s size may be similar even as its shape descriptor changes. Avoid interpreting any one curve without considering the selected group and the underlying conformations.
In practice, the key is to make the selection match the question. A result describes the group you chose, not automatically the whole molecule. If the scientific question concerns a particular domain or set of atoms, define that group deliberately and use the same selection when making comparisons.
For setup details, see the Asphericity documentation.
Note: SAMSON and all SAMSON Extensions are free for non-commercial use. Get SAMSON.