



A molecular group can change its overall shape even when a simple distance measurement barely moves. It may become more elongated, flatten, or otherwise depart from a sphere. If you are comparing structures along a path or trajectory, relying on one coarse descriptor can leave that change hard to spot.
Asphericity offers another way to monitor global shape: it reports how far a selected group deviates from a spherical shape. It does not replace other measurements, but it can help answer a useful question: Is this group’s overall shape changing as the system moves along the path?
When can this help?
Imagine that you are inspecting a structural transition and tracking the radius of gyration. That measurement can be useful for following the overall spread of a group, but it may not fully describe how its shape is distributed. Asphericity adds a complementary view by tracking deviation from a sphere. Together, these observables can help distinguish “the group changed in size” from “the group changed in shape”—while remembering that neither measurement alone explains the structural cause.
This distinction is useful when comparing conformations, reviewing a modeled path, or looking for intervals where global shape changes. Asphericity is a descriptor, not a diagnosis: a change in its value is a reason to inspect the relevant structures, not proof of a particular molecular mechanism.
Set up the analysis
- Open Path Analyzer.
- Select Asphericity as the observable.
- Choose the path you want to examine.
- Define the atom-containing group to analyze.
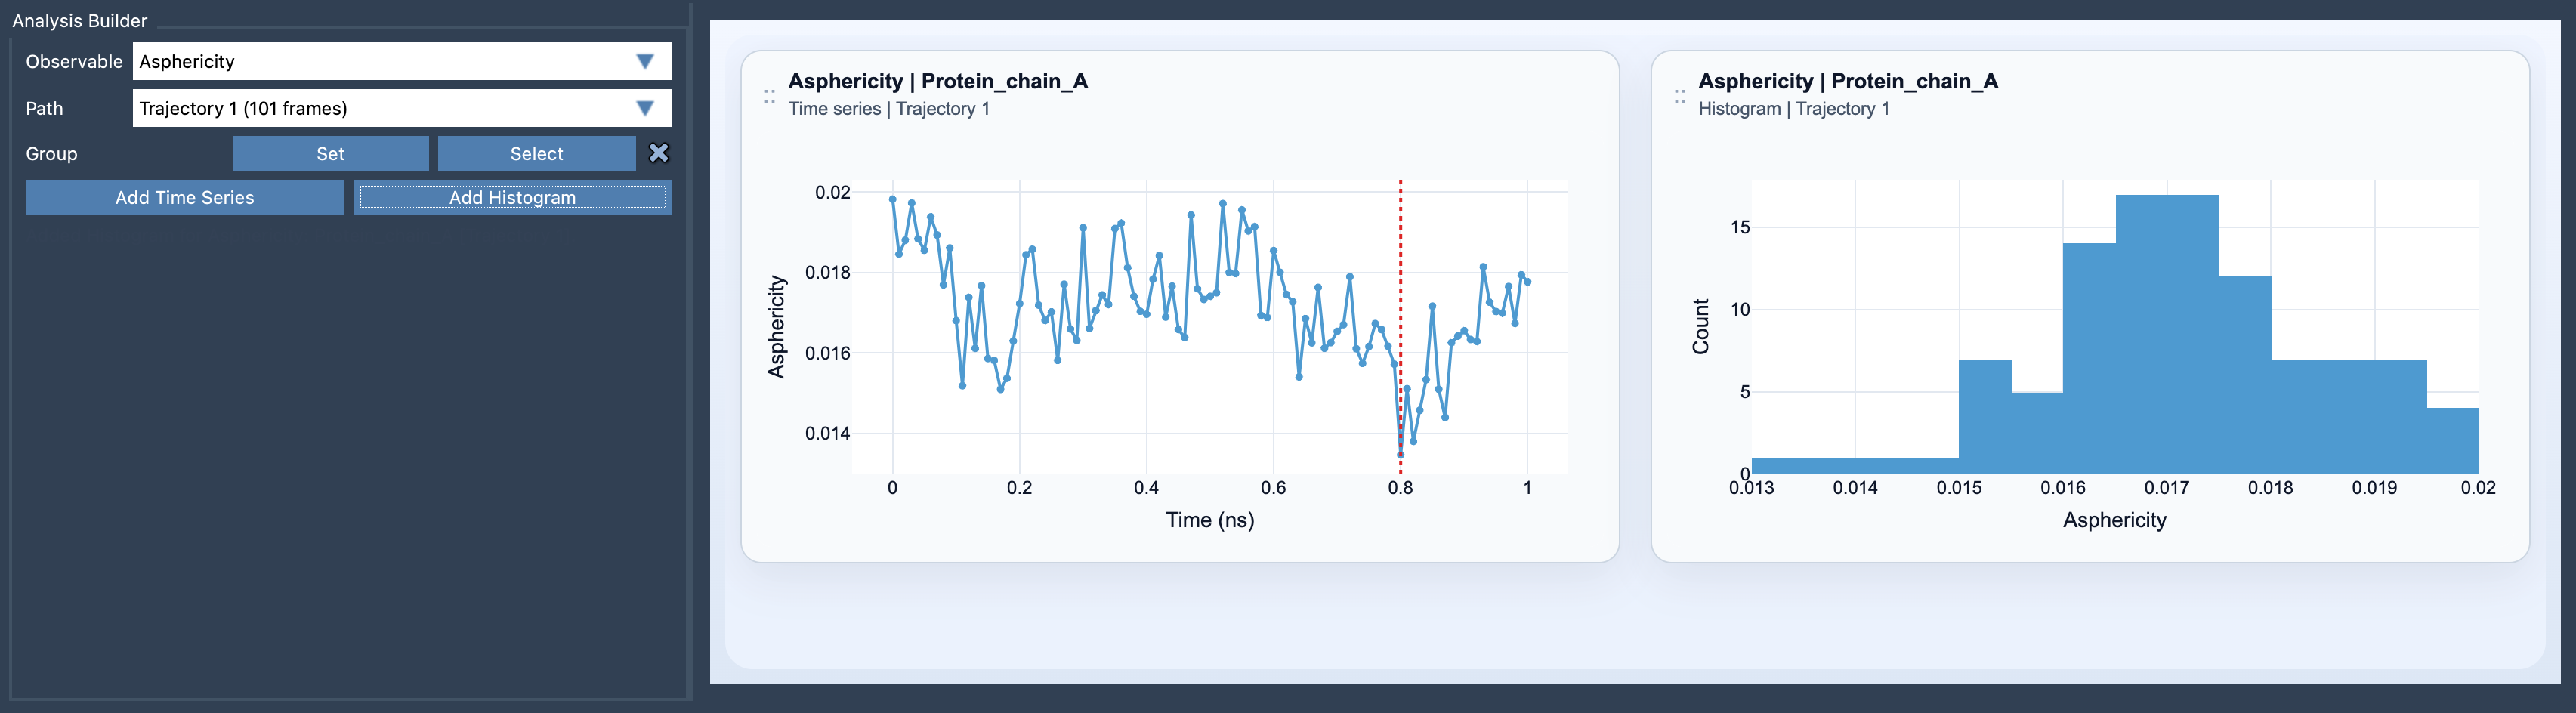
- Add a time series or a histogram.
The group selection matters: the result describes the selected atoms, so choose a group that matches the question you are asking. For a comparison across a path, keep the group definition consistent. Otherwise, a change in which atoms are included could complicate the interpretation of changes in the descriptor.
Choose a view that fits the question
A time series shows how the shape descriptor varies along the path. Use it to locate portions of the path where values change or remain relatively steady, then inspect those structures in context. A histogram summarizes the range of sampled values. It is useful for seeing how values are distributed overall, but it does not show where along the path a particular value occurred. If the order of structural events matters, the time series retains that context.
Read it alongside other observables
Asphericity is most informative as part of a broader picture. The SAMSON documentation suggests pairing it with radius of gyration and shape parameter. These views can help you examine global shape changes from complementary angles rather than asking one number to tell the entire story.
A practical workflow is to first use the time series to spot an interval of interest, then inspect the corresponding structures and compare the companion observables. Use the histogram when you want an overview of sampled values, and return to the path when you need to understand their order. This turns a compact shape descriptor into a useful prompt for closer structural inspection.
For setup details, see the Asphericity documentation.
Note: SAMSON and all SAMSON Extensions are free for non-commercial use. Get SAMSON.