



A ligand can move through a protein along a complicated route, but a sequence of structures does not always make that route easy to read. Looking at every atom at once can be visually overwhelming: the motion of the group gets lost among its details. A center-of-mass pathline offers a simpler view. It turns the motion of a selected atom group into a trace you can follow through the structure.
This is useful when you want to understand the overall route of a ligand, compare paths, or see how a selected region moves during a conformational change. The important distinction is that a pathline summarizes the group’s motion; it does not show every atom’s individual trajectory or explain the physical cause of the movement.
What a pathline shows
In SAMSON, the Pathlines visual model displays the center-of-mass (COM) trajectory of selected atoms along one or more paths. Think of it as a moving group’s representative point: instead of drawing a separate trace for every atom, the visualization follows the group’s center of mass as the path progresses.
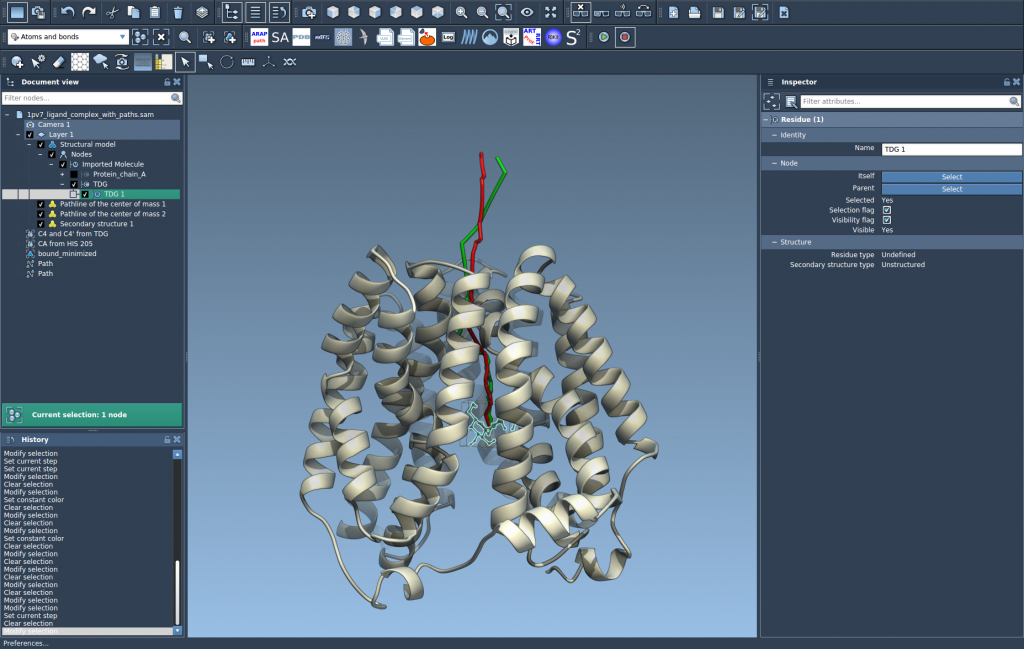
That summary can make a crowded molecular scene easier to interpret. For example, a ligand’s COM trace can help reveal its overall unbinding route relative to the protein. A pathline can also help communicate collective movement in a domain or another selected atom group.

Keep the summary’s limits in mind: a COM trace is not a substitute for inspecting the atoms themselves. A group may rotate or change shape while its center follows a relatively simple route. If those internal changes matter to your question, inspect the structure and path as well as the pathline.
Make the visualization answer a clear question
Before creating a pathline, decide what you want the trace to represent. Select the ligand to follow its overall movement, or select a residue or larger atom group to track that group’s COM. Also choose the path or paths you want to display. This makes the resulting visualization more focused than simply drawing every available trace.
In the Document view, select the desired atoms and one or more paths. To select multiple nodes, hold Ctrl on Windows or Linux, or Cmd on macOS, while selecting. There are useful defaults: if no atoms are selected, SAMSON uses the entire system; if no paths are selected, it uses all paths in the document. Those defaults can be convenient, but they may produce a broader visualization than intended—so check your selection before creating the model.
Create the pathline
- Open Visualization > Visual model > More…. The shortcut is Ctrl/Cmd + Shift + V.
- Choose Pathline of the center of mass, then click OK.
The visual model will show the selected group’s COM motion along the selected path or paths.
Explore the path, not just the trace
A pathline is most informative when you can relate it back to the path that generated it. In the Document view, double-click a path to start or stop it. Right-click a path to find its Path > … options. To inspect path controllers, select the path and open the Inspector with Ctrl/Cmd + 2.
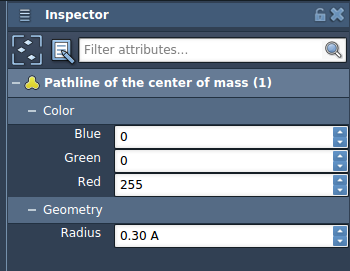
You can also select the pathline visual model and use the Inspector to adjust its color and thickness. These changes can make a trace easier to distinguish in a complex scene, especially when comparing multiple paths. If a path is deleted, its associated pathline is removed too; deleting atoms used by a pathline changes the visualization.
A practical example: ligand unbinding
The tutorial’s sample document contains lactose permease (1PV7), the ligand thiodigalactosid (TDG), and two paths generated with Ligand Path Finder. Following the ligand’s COM along these paths gives you a compact way to inspect its overall movement. Comparing traces can help you see whether the routes differ in direction or spatial extent, while the underlying structures and paths provide the molecular detail needed to interpret those differences.
For this example, load the sample through Home > Download using the sample document. The Pathlines extension must be added from SAMSON Connect and SAMSON restarted before using it. The extension page is Pathlines.
Use a pathline when the question is about the route taken by a group as a whole. Use atom-level inspection when the question depends on internal rearrangement. Keeping that distinction clear makes the visualization easier to read—and helps prevent a clean-looking trace from being mistaken for the full molecular story.
For the complete workflow and related examples, learn more in the Pathlines documentation.
Note: SAMSON and all SAMSON Extensions are free for non-commercial use. Get SAMSON.