



A protein–ligand pose can look convincing in 3D and still be difficult to review. Atoms overlap visually, important contacts are buried, and explaining what is near the ligand often means repeatedly switching between views. An interaction diagram can make that inspection easier—but it helps to know what the diagram shows, and what it does not.
SAMSON’s Interaction Designer connects a 2D interaction diagram to the 3D viewport. Select a structure, atom, or residue in the diagram to work with it in 3D; double-click a structure or atom to zoom to it. The connection goes both ways: selecting, adding, or removing atoms and fragments in the 2D document is synchronized with the 3D view.

Build a diagram around the question you have
Use Home > Diagram to create a diagram from the current selection. If nothing is selected, SAMSON uses the whole document. Starting with a relevant selection can help keep the view focused when you are reviewing a particular ligand or region.
For protein–ligand inspection, the diagram can show the binding pocket, solvent accessibility of ligand atoms, and interacting residues or structural groups. This can help answer practical review questions: Which residues are close to the ligand? Where are the detected contacts concentrated? Which ligand atoms are shown as solvent-accessible?
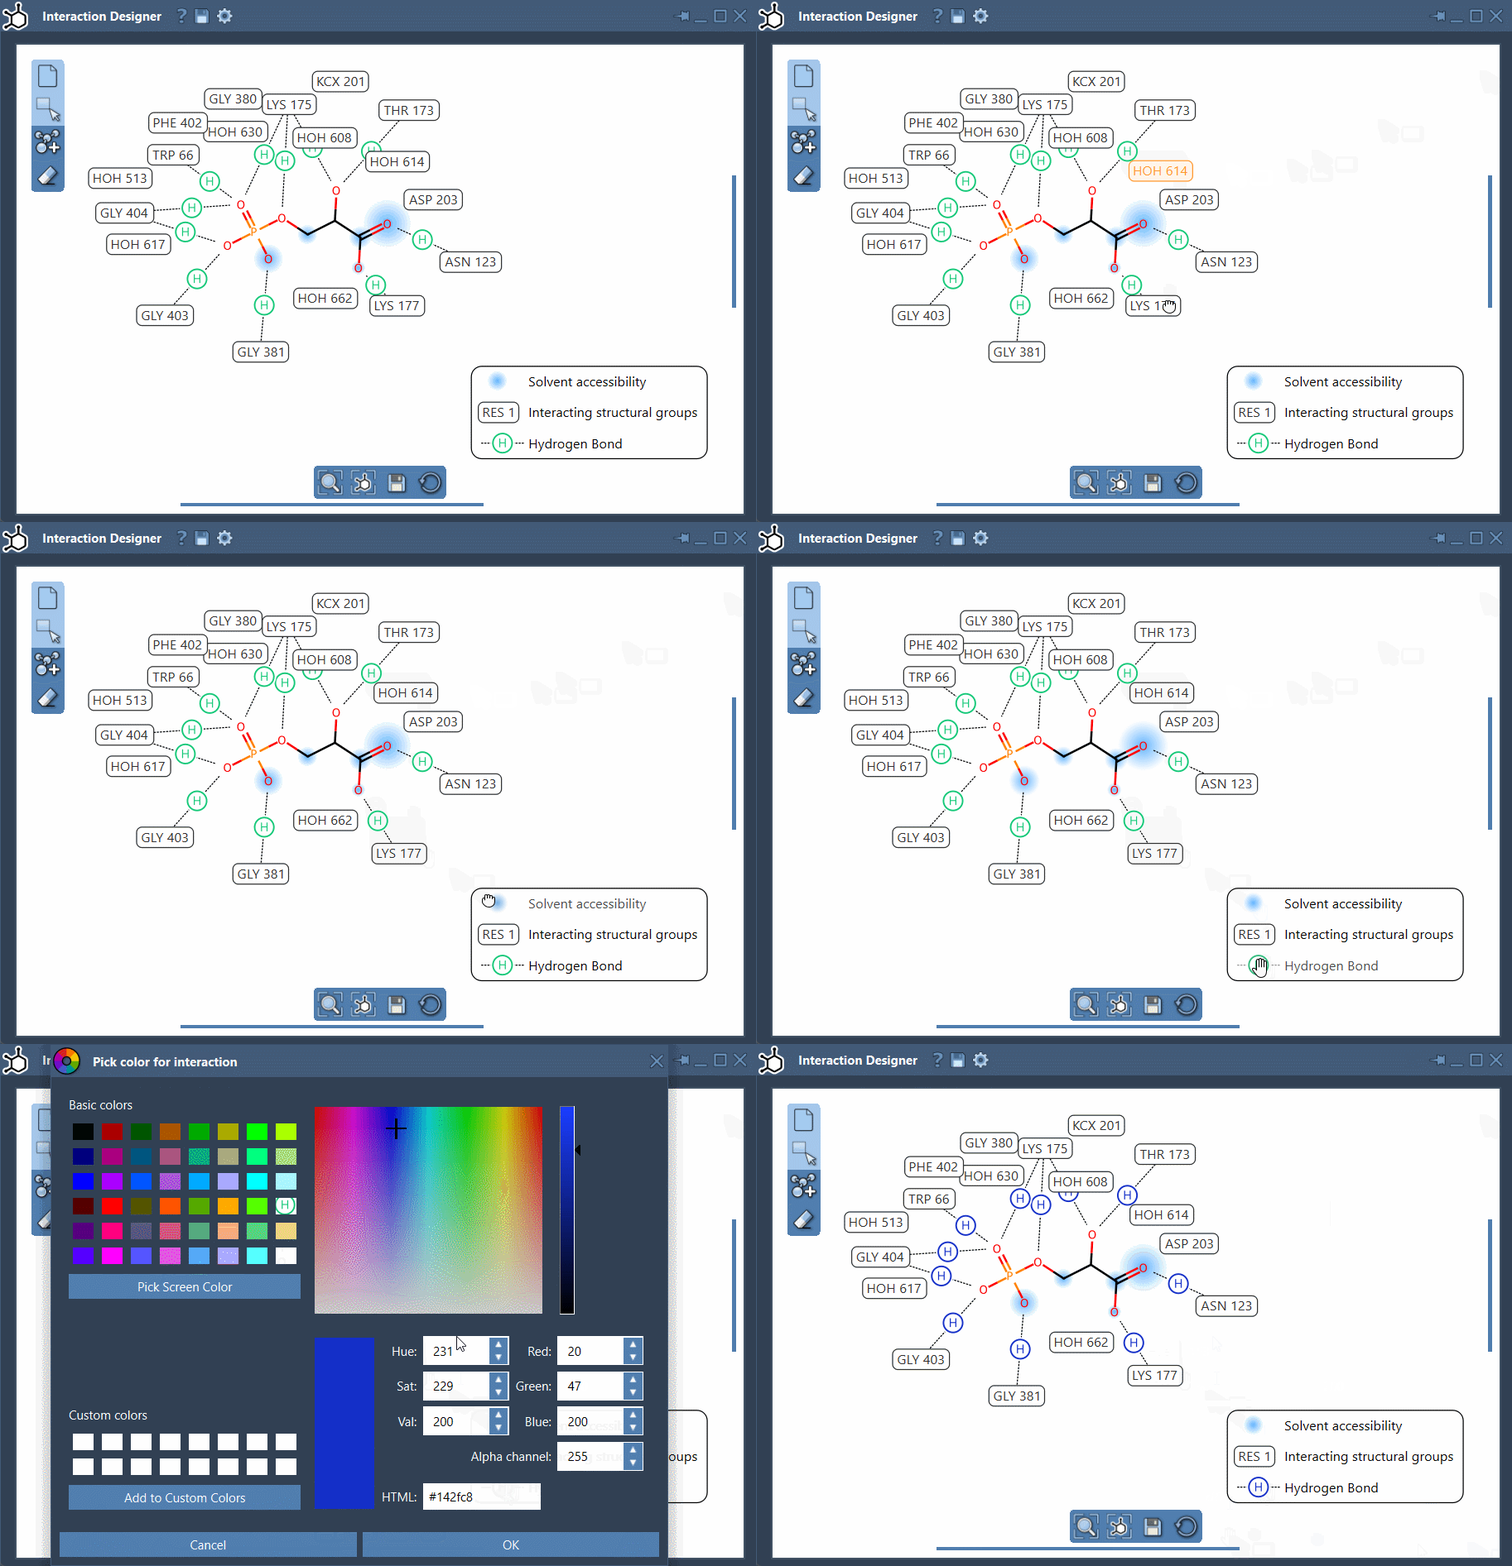
The diagram is editable rather than a fixed report. Move labels and interaction symbols to reduce clutter or make a feature easier to follow. Click an interaction name or icon in the caption to hide or show that category; double-click it to change its color. The legend can therefore be adjusted to make a particular contact family easier to inspect or present.
Read detected contacts as geometric evidence
The listed categories include hydrogen bonds, ionic interactions, metal coordination, steric clashes, aromatic contacts, and several atom–plane or group–group interactions. Their detection uses atom categories and geometric criteria, which can include distances, angles, and ring centroids. The exact criterion depends on the contact type.
That distinction matters: a detected contact means the geometry meets the implemented criteria. It does not establish that the contact stabilizes the complex, prove a binding mechanism, or estimate interaction energy. Treat the diagram as a way to organize and inspect structural evidence—not as a binding-affinity score. A useful review is to follow a contact back to the 3D structure, check its local geometry, and consider it in the context of the whole pose.
Water can participate as environment metadata when a contact involves water, but the current implementation does not create a separate water-specific interaction type. Likewise, contact categories are descriptions of detected geometry, not all-purpose labels for molecular function.
Keep the 2D view useful
If the diagram becomes crowded, hide categories you are not currently examining, reposition labels, and use the bottom menu to update the view and align the 2D and 3D displays. Hold Ctrl or Cmd while scrolling to zoom. To translate the diagram, hold the middle or right mouse button while moving the mouse.
When the layout is ready to share, use Save in the bottom panel to export the diagram as an image, including PNG, JPG, BMP, or SVG formats. This makes it easier to include a clean, focused view in notes or a presentation.
For the full workflow and the current list of supported interaction categories, see the Interaction Designer documentation.
Note: SAMSON and all SAMSON Extensions are free for non-commercial use. Get SAMSON.