



A molecular structure can look nearly unchanged at a glance while its backbone states are shifting across a trajectory. The reverse is also true: a local change may be difficult to interpret when you are looking at many frames one by one. When the question is “Is this protein becoming more helical, more beta-rich, or less ordered along this path?”, a per-frame summary can provide a useful first read.
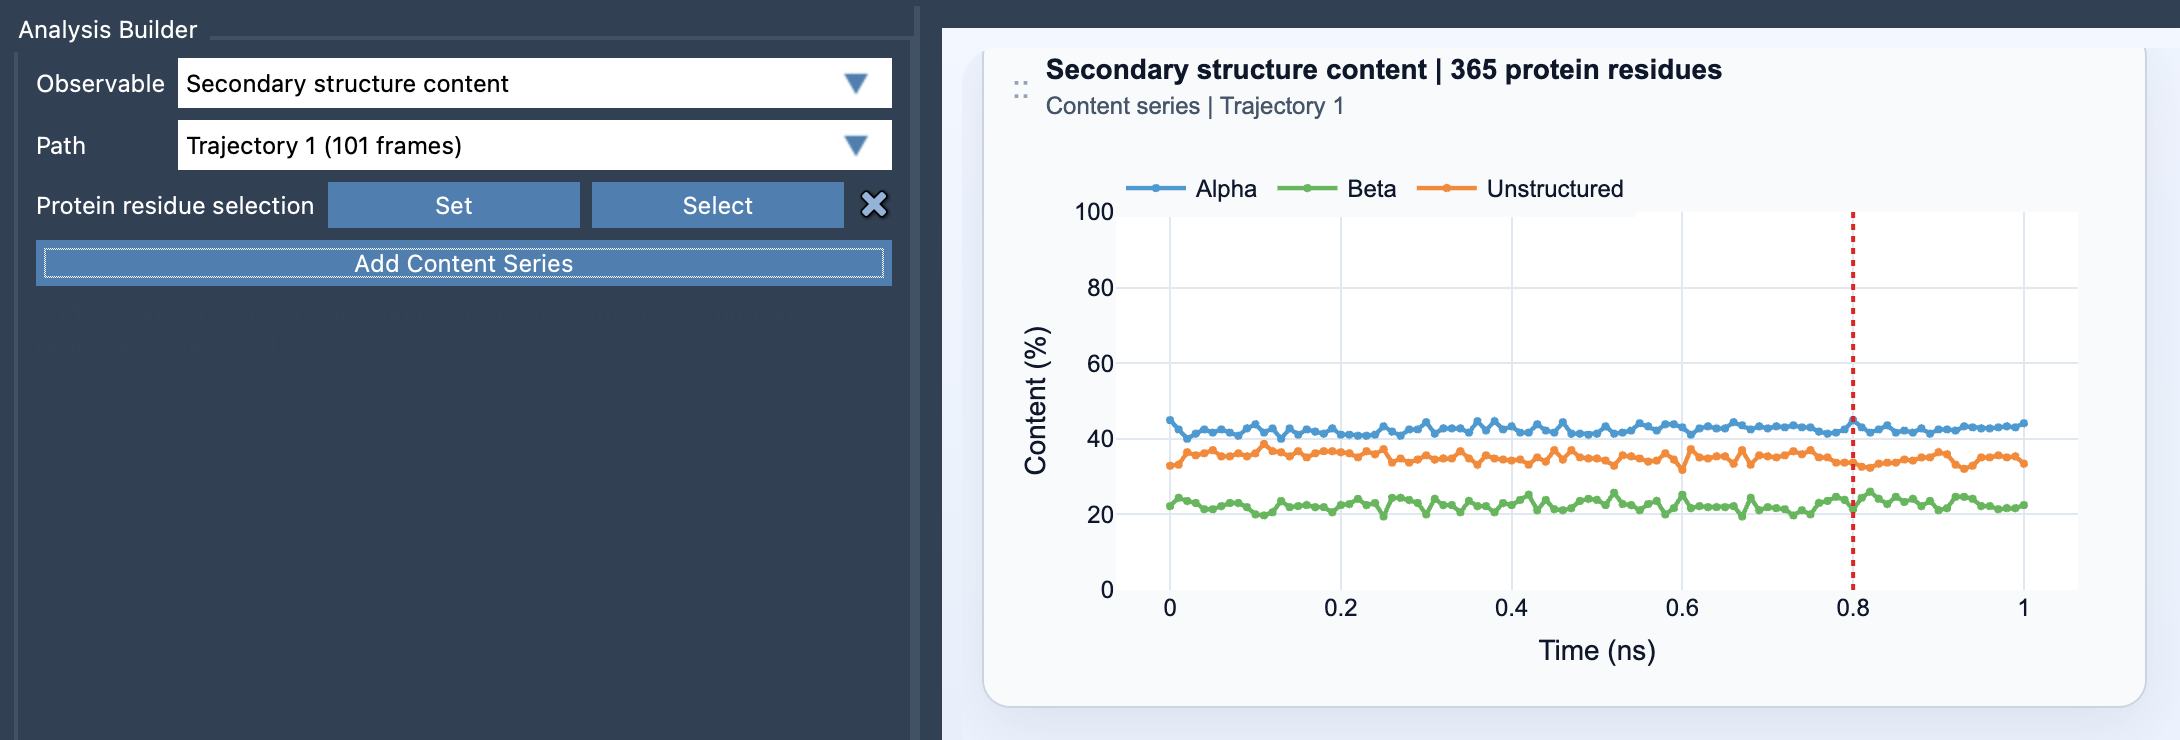
Path Analyzer’s Secondary structure content analysis tracks the percentages of selected protein residues classified as alpha, beta, or unstructured at each frame. It turns a sequence of structures into a multi-series plot, making broad backbone-state changes easier to spot than by relying on visual inspection alone.
Start with the question, then choose the selection
The most useful selection depends on what you are trying to understand. For a protein-wide overview, use a broad selection of protein residues. If you are investigating a particular domain, helix bundle, or loop-rich region, focus the selection on that part instead. A focused selection can help distinguish a local change from the behavior of the rest of the protein.
To create the plot, open Path Analyzer, choose Secondary structure content as the observable, select a path, and define a protein residue selection. Then click Add Content Series. The selection must contain atoms belonging to protein residues. Path Analyzer recomputes secondary structure along the path and reports the three categories for each frame.
Read the plot as a composition, not a residue map
Each series represents a percentage from 0 to 100%: alpha, beta, or unstructured. At frame t, each percentage is calculated as the number of selected residues assigned to that category divided by the total number of selected protein residues, multiplied by 100. In other words, the plot answers “what fraction of my selection is in this category at this frame?” It does not identify which individual residues changed state.
That distinction matters when interpreting a trend. A rise in the alpha series tells you that a larger share of the selection is classified as alpha at that point in the path; it does not, by itself, tell you where the change occurred or what caused it. Treat the plot as a high-level summary that helps you decide where to look next.
A practical way to investigate a change
- Check the selection. Confirm that it matches the biological region you want to study. A protein-wide selection and a single-domain selection answer different questions.
- Look for where the trend changes. Identify the frames where the proportions begin to shift, rather than focusing only on the starting and ending values.
- Compare categories together. Consider the alpha, beta, and unstructured series as parts of the same composition. A change in one category can be easier to interpret in the context of the others.
- Follow up at residue level. If the summary suggests a meaningful transition, inspect the relevant structural region. Pairing the content plot with the Ramachandran analysis can add residue-level backbone detail.
This workflow is useful when scanning a path for broad structural changes, comparing the behavior of a domain with that of the full protein, or deciding which frames deserve closer inspection. The summary narrows the search; structural inspection provides the detail needed to interpret it.
For setup details and the definitions used in the analysis, see the Secondary Structure Content documentation.
Note: SAMSON and all SAMSON Extensions are free for non-commercial use. Get SAMSON at samson-connect.net.