



A protein path can contain many frames, and inspecting each structure one by one makes it easy to miss the overall pattern. Did a region gradually lose alpha-helical structure? Did beta content rise along the path? Or is most of the selected protein classified as unstructured? A compact summary of secondary-structure content can help answer these questions before you dive into individual residues.
Secondary structure content in SAMSON’s Path Analyzer tracks the proportion of a selected protein region classified as alpha, beta, or unstructured at each frame. The result is a multi-series plot, with values from 0 to 100%. It offers a high-level view of backbone-state changes across a path—not a replacement for examining the structures themselves.
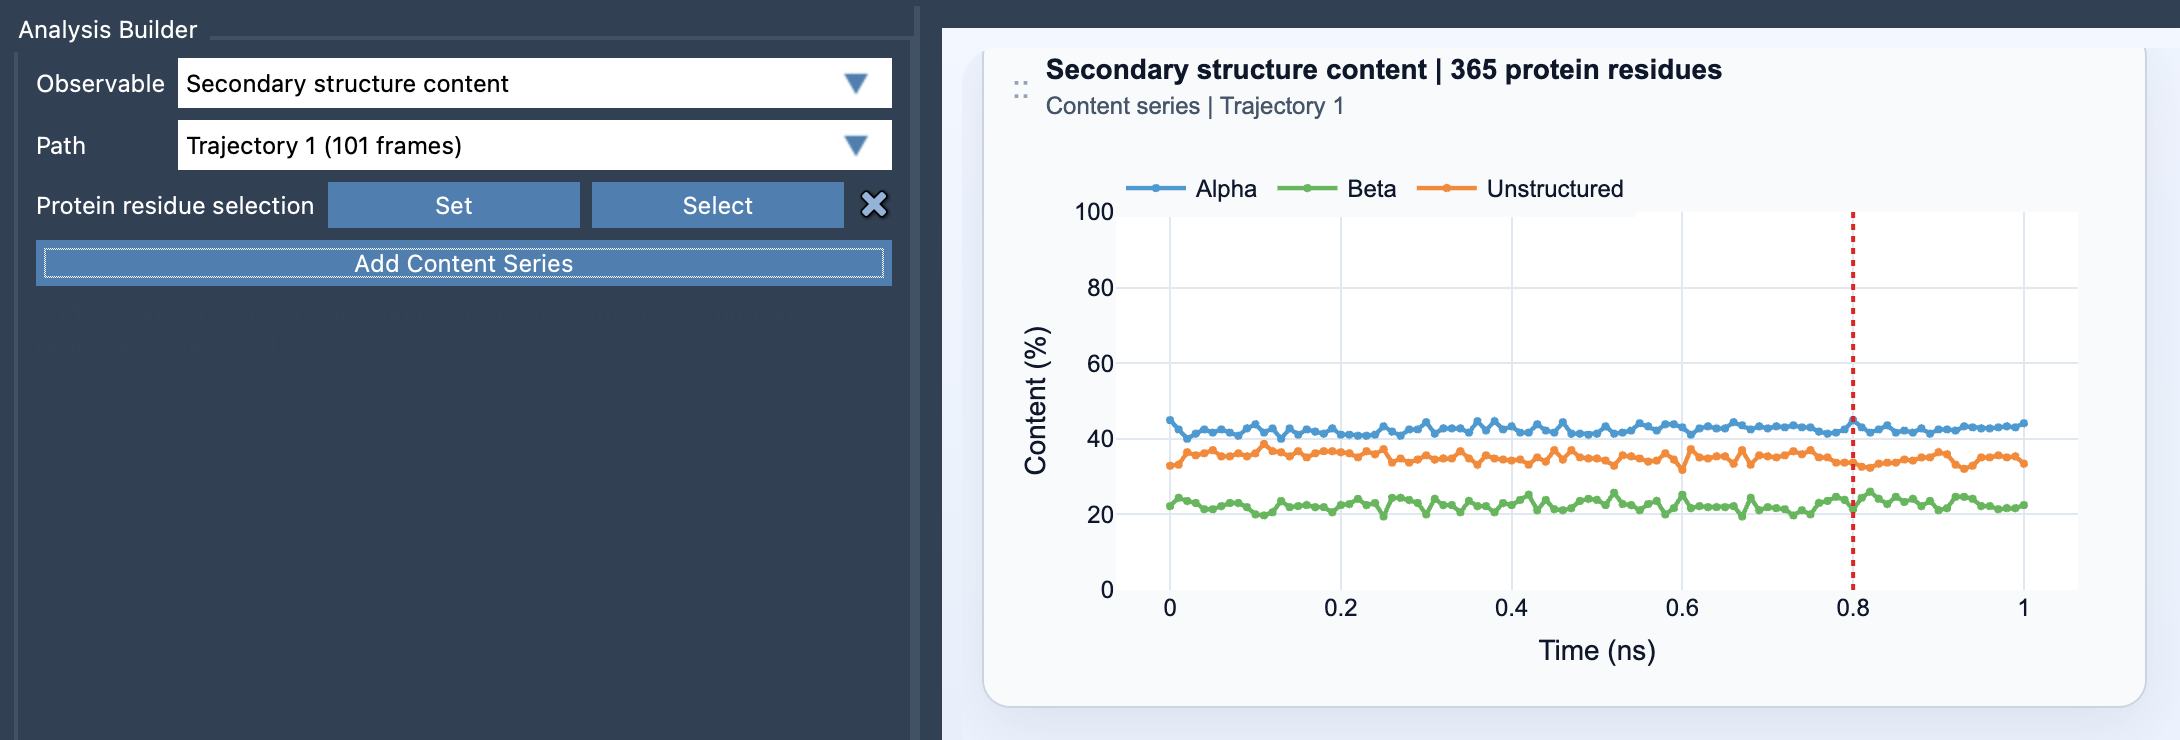
Read the plot as a changing composition
Each plotted value is a percentage of the selected protein residues at a frame. If Nα(t), Nβ(t), and Nunstructured(t) are the respective residue counts at frame t, and Nres is the total number of selected protein residues, the reported values are:
%α(t) = 100 × Nα(t) / Nres%β(t) = 100 × Nβ(t) / Nres%unstructured(t) = 100 × Nunstructured(t) / Nres
This normalization makes the plot useful for following changes in a chosen region even when the raw counts alone would be hard to interpret. For example, a change in alpha percentage means the share of selected residues classified as alpha has changed. It does not, by itself, identify which residues changed or explain why.
Choose the selection to match the question
The selection determines what the percentages describe. For a protein-wide summary, use a broad selection. If you are investigating a particular domain, helix bundle, or loop-rich region, use a focused selection instead. A whole-protein average can hide a local change: one region may shift while the rest of the protein remains much the same. Conversely, a small selection gives a more targeted view but should not be mistaken for a summary of the entire protein.
The selection must contain atoms belonging to protein residues. Before interpreting a plot, check that the selected residues correspond to the part of the model you intended to analyze. The denominator is the total number of selected protein residues, so changing the selection changes the meaning of every percentage.
A practical way to use the summary
- Open Path Analyzer and choose Secondary structure content as the observable.
- Select the path you want to inspect.
- Define a protein residue selection that matches your analysis question.
- Click Add Content Series to create the plot.
- Look for where the plotted proportions change, then inspect those parts of the path in the molecular view.
Use the plot to locate noteworthy transitions, not to assign a mechanism from percentages alone. A rise or fall is a useful pointer to frames worth investigating; it does not tell you whether a change is favorable, stable, or biologically meaningful. For more detailed backbone context, pair the summary with a residue-level analysis such as the Path Analyzer’s Ramachandran observable.
This two-level approach can make analysis more manageable: first identify broad changes in the secondary-structure composition, then focus on the relevant residues and frames. To see the full setup and equations, visit the Secondary Structure Content documentation.
Note: SAMSON and all SAMSON Extensions are free for non-commercial use. Get SAMSON.