



A molecular structure can look more compact in one view and more extended in another. Rotation, perspective, and the motion of individual atoms can make visual comparisons difficult, especially when you are examining many frames along a path. A useful first check is to track a single measure of overall compactness: the radius of gyration.
Radius of gyration follows the overall compactness of a selected group along a path or trajectory. Instead of relying on a few snapshots, you can see whether the group becomes more compact, expands, or changes little across the path. The result is reported in ångströms (A).
Start with a consistent group
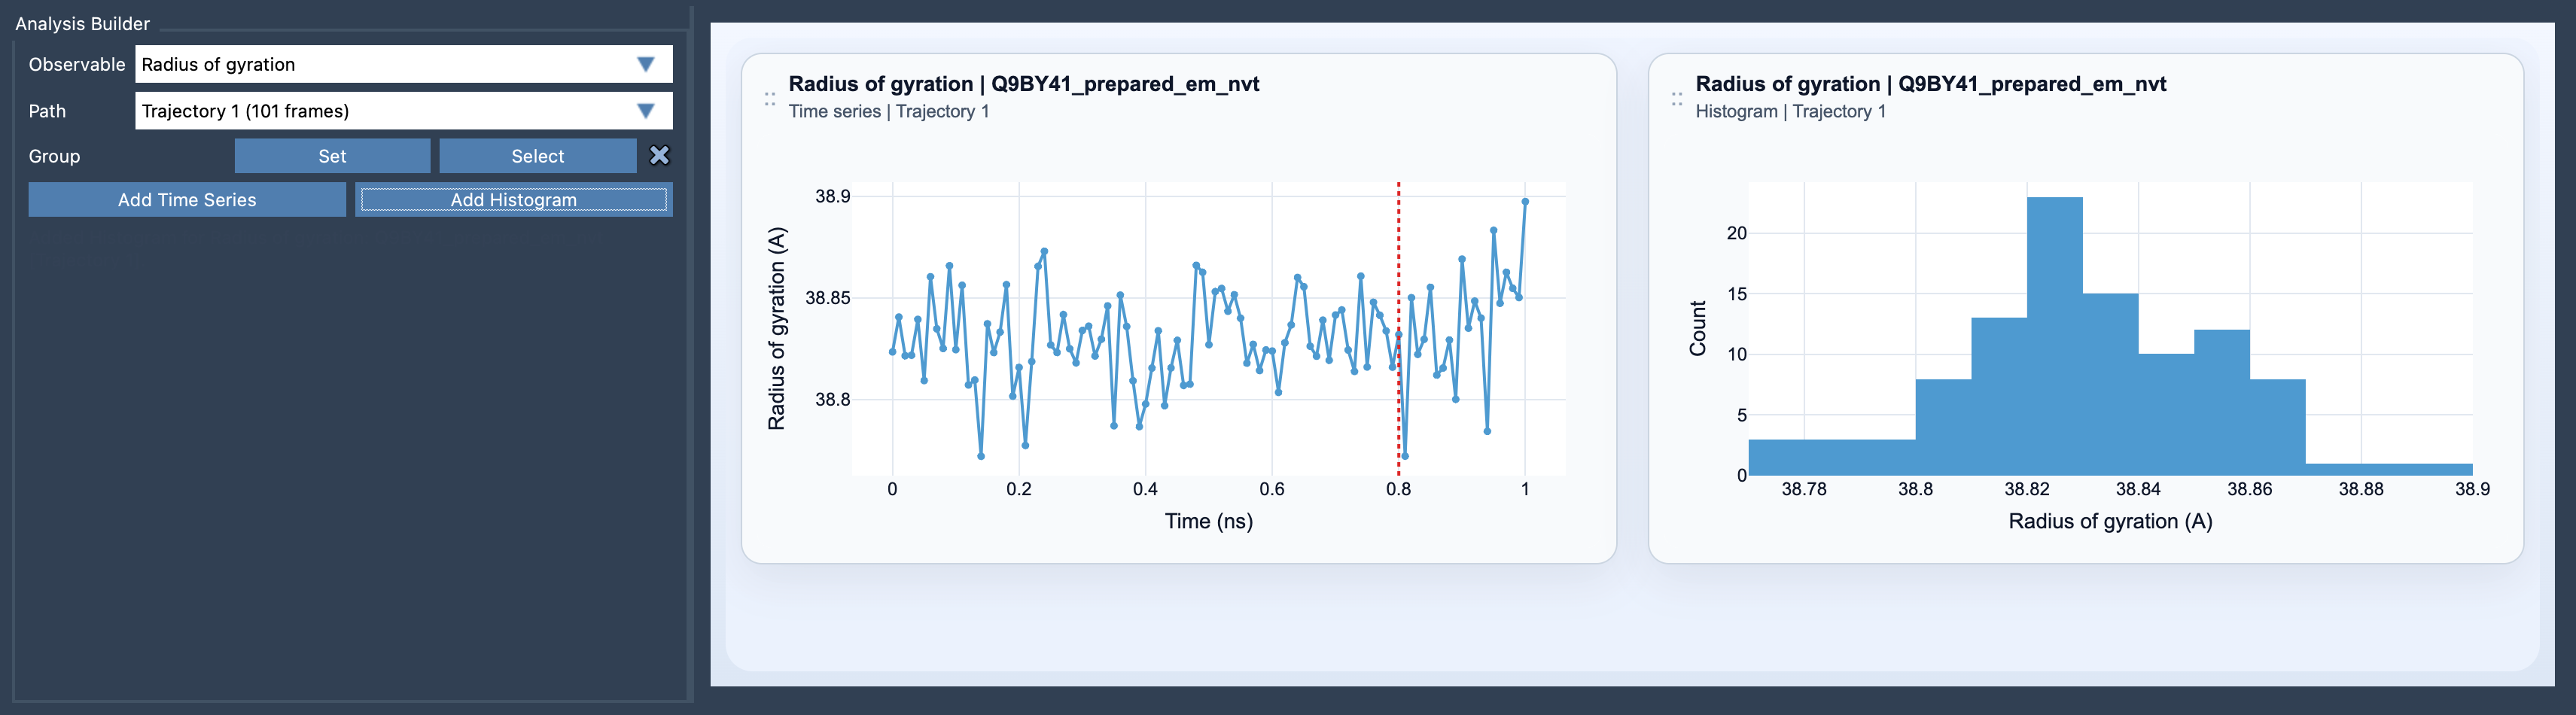
In SAMSON’s Path Analyzer, choose Radius of gyration as the observable, select a path, and define the group you want to analyze. The analysis requires one atom-containing selection.
For a meaningful comparison, keep the group consistent across the analysis. If you change which atoms are included, a change in the result could reflect the selection rather than a change in the structure. Think first about the question you want to answer: are you interested in the compactness of the whole molecule, or of a particular atom-containing part?
Choose the view that answers your question
A time series shows how compactness varies along the path. It is useful for spotting broad trends and asking when expansion or compaction occurs. A histogram gives another perspective: it helps you inspect the range of compactness values represented along the path.
These views are complementary. A time series preserves the order of observations, while a histogram makes it easier to focus on the values that occur across the sampled path. If the order of changes matters, start with the time series. If you want to summarize the range of observed compactness, inspect the histogram as well.
Read the result as a first diagnostic
A changing radius of gyration is evidence that the selected group’s overall compactness is changing. It can be a helpful first diagnostic when investigating folding, compaction, or swelling. But it is not a complete description of shape: groups with different shapes can have similar compactness, and the measure alone does not tell you how a shape changed.
That distinction helps prevent a common interpretation trap. A radius-of-gyration plot can flag a structural change worth investigating, but it cannot by itself explain the change or establish what caused it. Use it to identify where a closer look may be useful, then inspect the structures and consider complementary observables. SAMSON’s Path Analyzer documentation suggests pairing radius of gyration with Asphericity or Shape parameter when you also want to examine how the shape changes.
A practical reading sequence
- Select the atom-containing group that matches your question.
- Plot radius of gyration along the path to find broad changes in compactness.
- Use the histogram to review the range of values across the path.
- Inspect relevant structures and add a shape-focused observable if compactness alone does not answer the question.
This workflow turns a visual impression into a measurable starting point, while keeping the interpretation appropriately focused: radius of gyration describes overall compactness, not every aspect of molecular shape.
For the setup details, see the Radius of Gyration documentation.
Note: SAMSON and all SAMSON Extensions are free for non-commercial use. Get SAMSON.