



A protein path can be difficult to interpret from structure views alone. A loop may move, a motif may shift, or a residue may appear to change conformation—but which parts of the backbone are changing, and at what point along the path? The Ramachandran plot offers a focused way to inspect those changes by placing backbone conformations in φ/ψ space.
Rather than looking only at the overall motion, you can use the plot to follow backbone conformations across the frames of a path. This is useful when you are investigating a possible conformational outlier, comparing a local region with the rest of a protein, or trying to see where a backbone transition occurs.
Start with a question, then choose the selection
The most useful selection depends on what you want to learn. If you are investigating one loop, motif, or active site, select the residues in that region. A focused selection makes it easier to keep attention on the part of the protein that prompted the analysis. If your question is about broader conformational sampling, use a wider protein selection to see a more global picture.
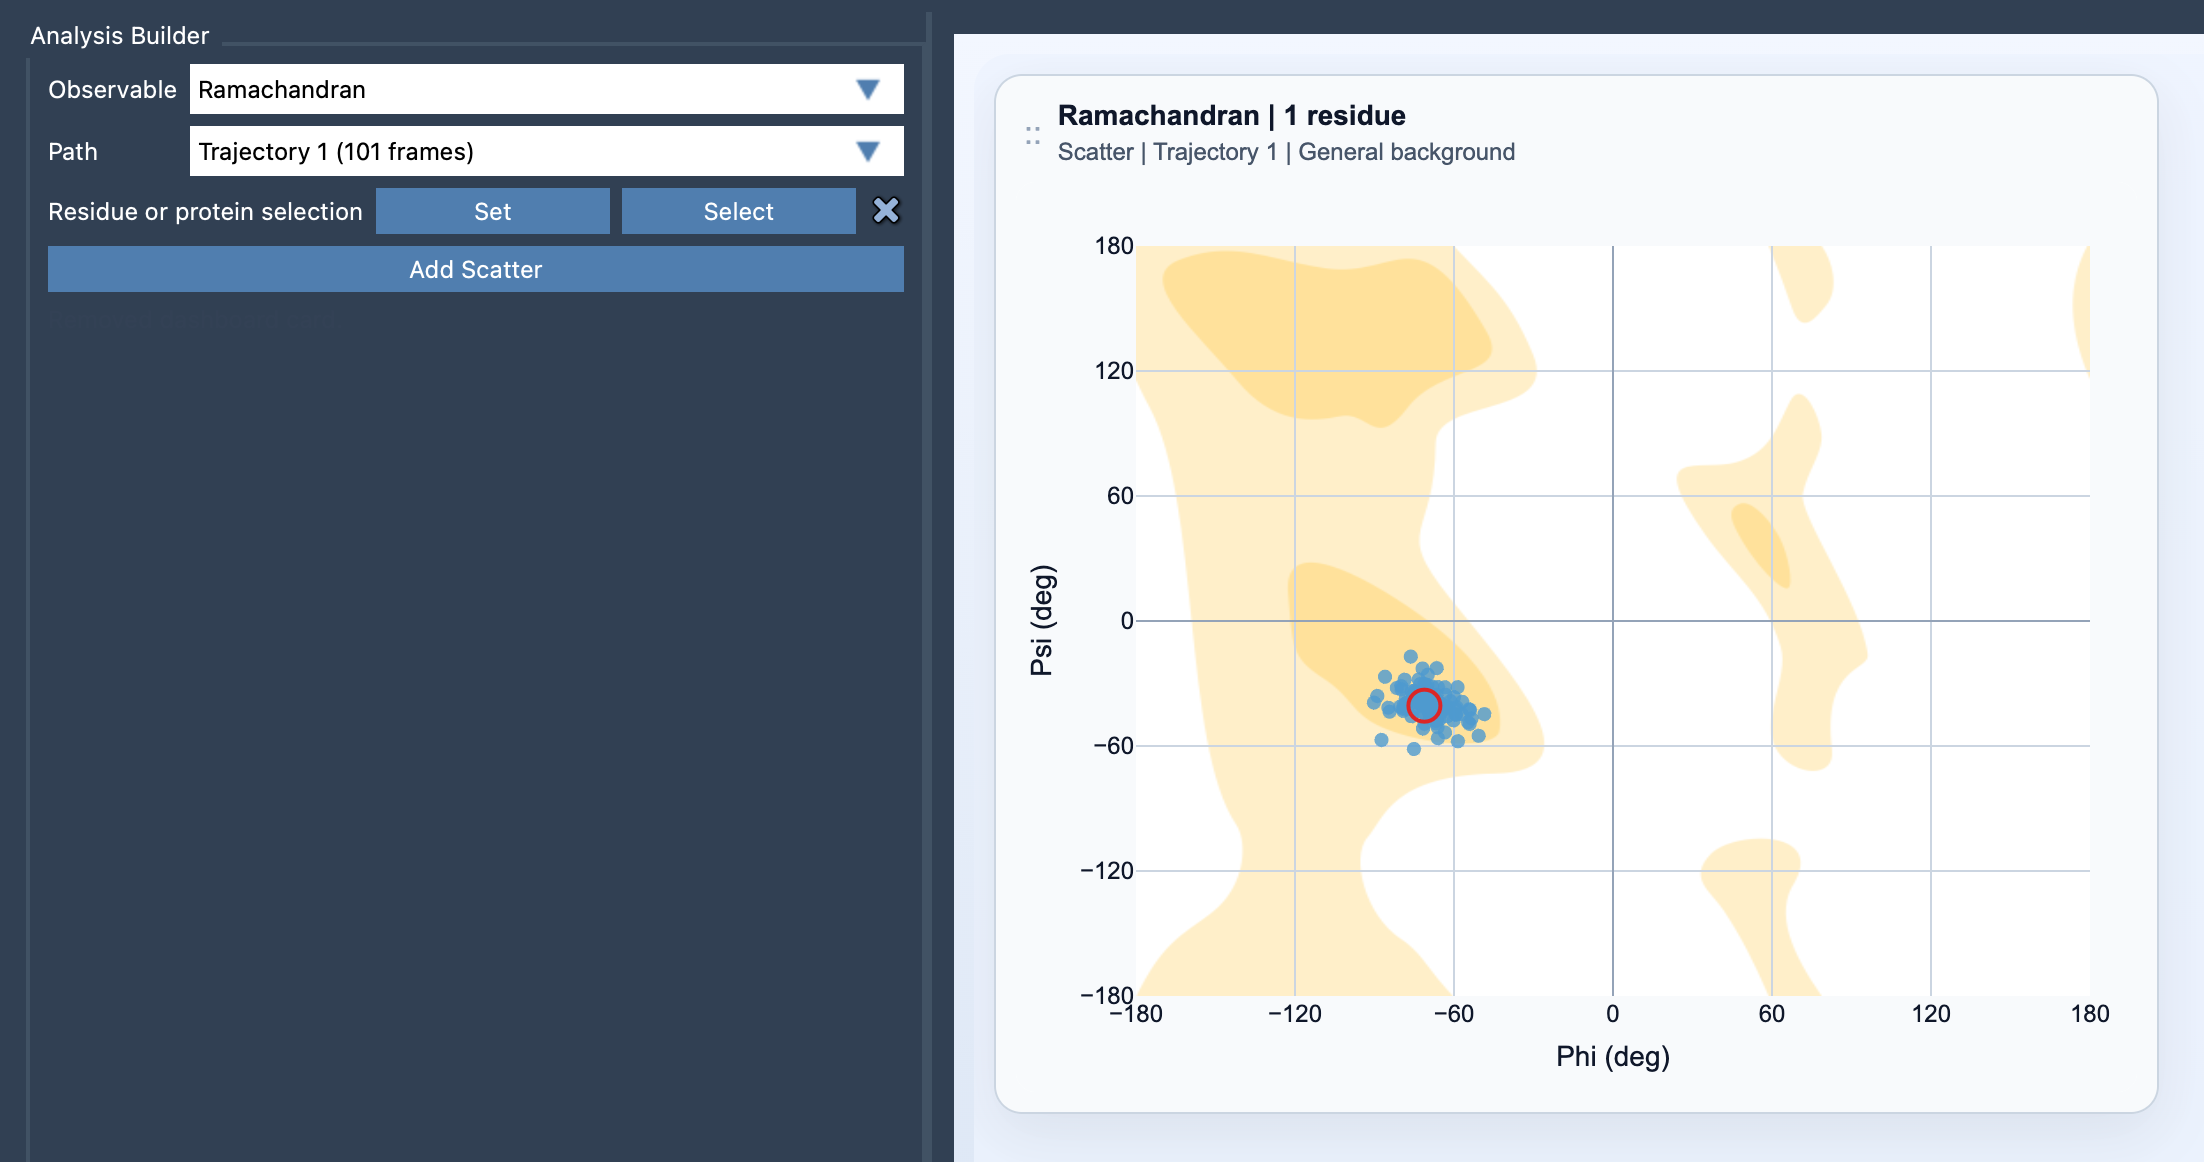
In Path Analyzer, choose Ramachandran as the observable, choose the path, define a residue or protein selection, and click Add Scatter. The selection must contain atoms belonging to protein residues. Each valid residue contributes φ/ψ points across the path.
Use the plot to locate change—not to guess its cause
The scatter view places φ on the x-axis and ψ on the y-axis. Its value is not just that it summarizes conformations: it helps connect a plotted point to a particular moment in the path. Click a point to move the path to its corresponding frame. When a point draws your attention, you can inspect that frame in the molecular view. Double-clicking the point selects the corresponding residue in SAMSON, making it easier to focus on the structure behind the observation.
A practical workflow is to begin with the region you care about, scan the points for conformations you want to investigate, and then use the point-to-frame interaction to inspect the associated structure. If you find an interesting change, you can widen the selection to put it in context. This keeps the plot connected to the actual molecular motion instead of treating it as an isolated diagram.
Combine views for a more useful interpretation
A Ramachandran plot describes backbone conformations in φ/ψ space. It does not, by itself, explain why a change occurred or provide the whole structural context. Treat it as one view of the path, then compare what you see with other relevant analyses. For example, Secondary structure content and RMSD can serve as complementary views when you are examining how a path evolves.
Path Analyzer chooses a suitable plot background automatically, and you can change it later in the card settings. This lets you begin exploring without needing to choose a background before you have seen the data.
The key is to use the plot as a guide to inspection: select the scale that matches your question, identify points worth following, and return to the corresponding frames and residues to examine the molecular structure.
For setup details, see the Ramachandran documentation.
Note: SAMSON and all SAMSON Extensions are free for non-commercial use. Get SAMSON.