



A protein–ligand structure can contain many possible contacts, and a crowded 3D view makes it difficult to see which residues are near the ligand. A 2D interaction diagram offers another way to inspect that neighborhood—but it is most useful when you can connect each symbol back to the structure and understand what the detector is, and is not, telling you.
In SAMSON, the Interaction Designer creates a diagram from the current selection, or from the whole document if nothing is selected. Choose Home > Diagram to start. The resulting view can show the binding pocket, ligand solvent accessibility, and interacting residues or structural groups. Click an atom or structure in the diagram to select it in the 3D view; double-click to zoom in. This connection makes it easier to move between a compact summary and the spatial context behind it.

Read contacts as geometric evidence
The diagram groups detected contacts into categories, including hydrogen bonds, ionic interactions, metal coordination, aromatic contacts, steric clashes, and several interactions involving aromatic planes or groups. These labels help organize what is close to what. They should not be read as a direct ranking of how favorable each contact is.
The detector uses atom categories and geometric criteria, such as distances, ring centroids, and angles. For example, a hydrogen bond is identified using donor–acceptor distance criteria and, when explicit hydrogens are present, a donor–hydrogen–acceptor angle criterion. A detected contact means the geometry meets the implemented criteria; it does not prove that the contact stabilizes the complex or provide an interaction energy. Treat the diagram as a way to inspect structural relationships, not as a substitute for energetic analysis.
That distinction is useful when discussing a binding pose. Instead of saying “this contact makes the ligand bind more tightly,” describe what the diagram supports: which atoms or groups are near one another, and which geometric category they meet. Then use other evidence if you need to assess energetic contribution.
Make the diagram easier to interpret
A default layout is a starting point, not a final figure. You can move labels and interaction symbols, as well as the caption or legend, to reduce overlap and make the important parts easier to follow. Click a category name or icon in the legend to hide or show that interaction type. If the colors are hard to distinguish, double-click the name or icon to change them; the Interaction Designer settings provide an option to restore the colors.
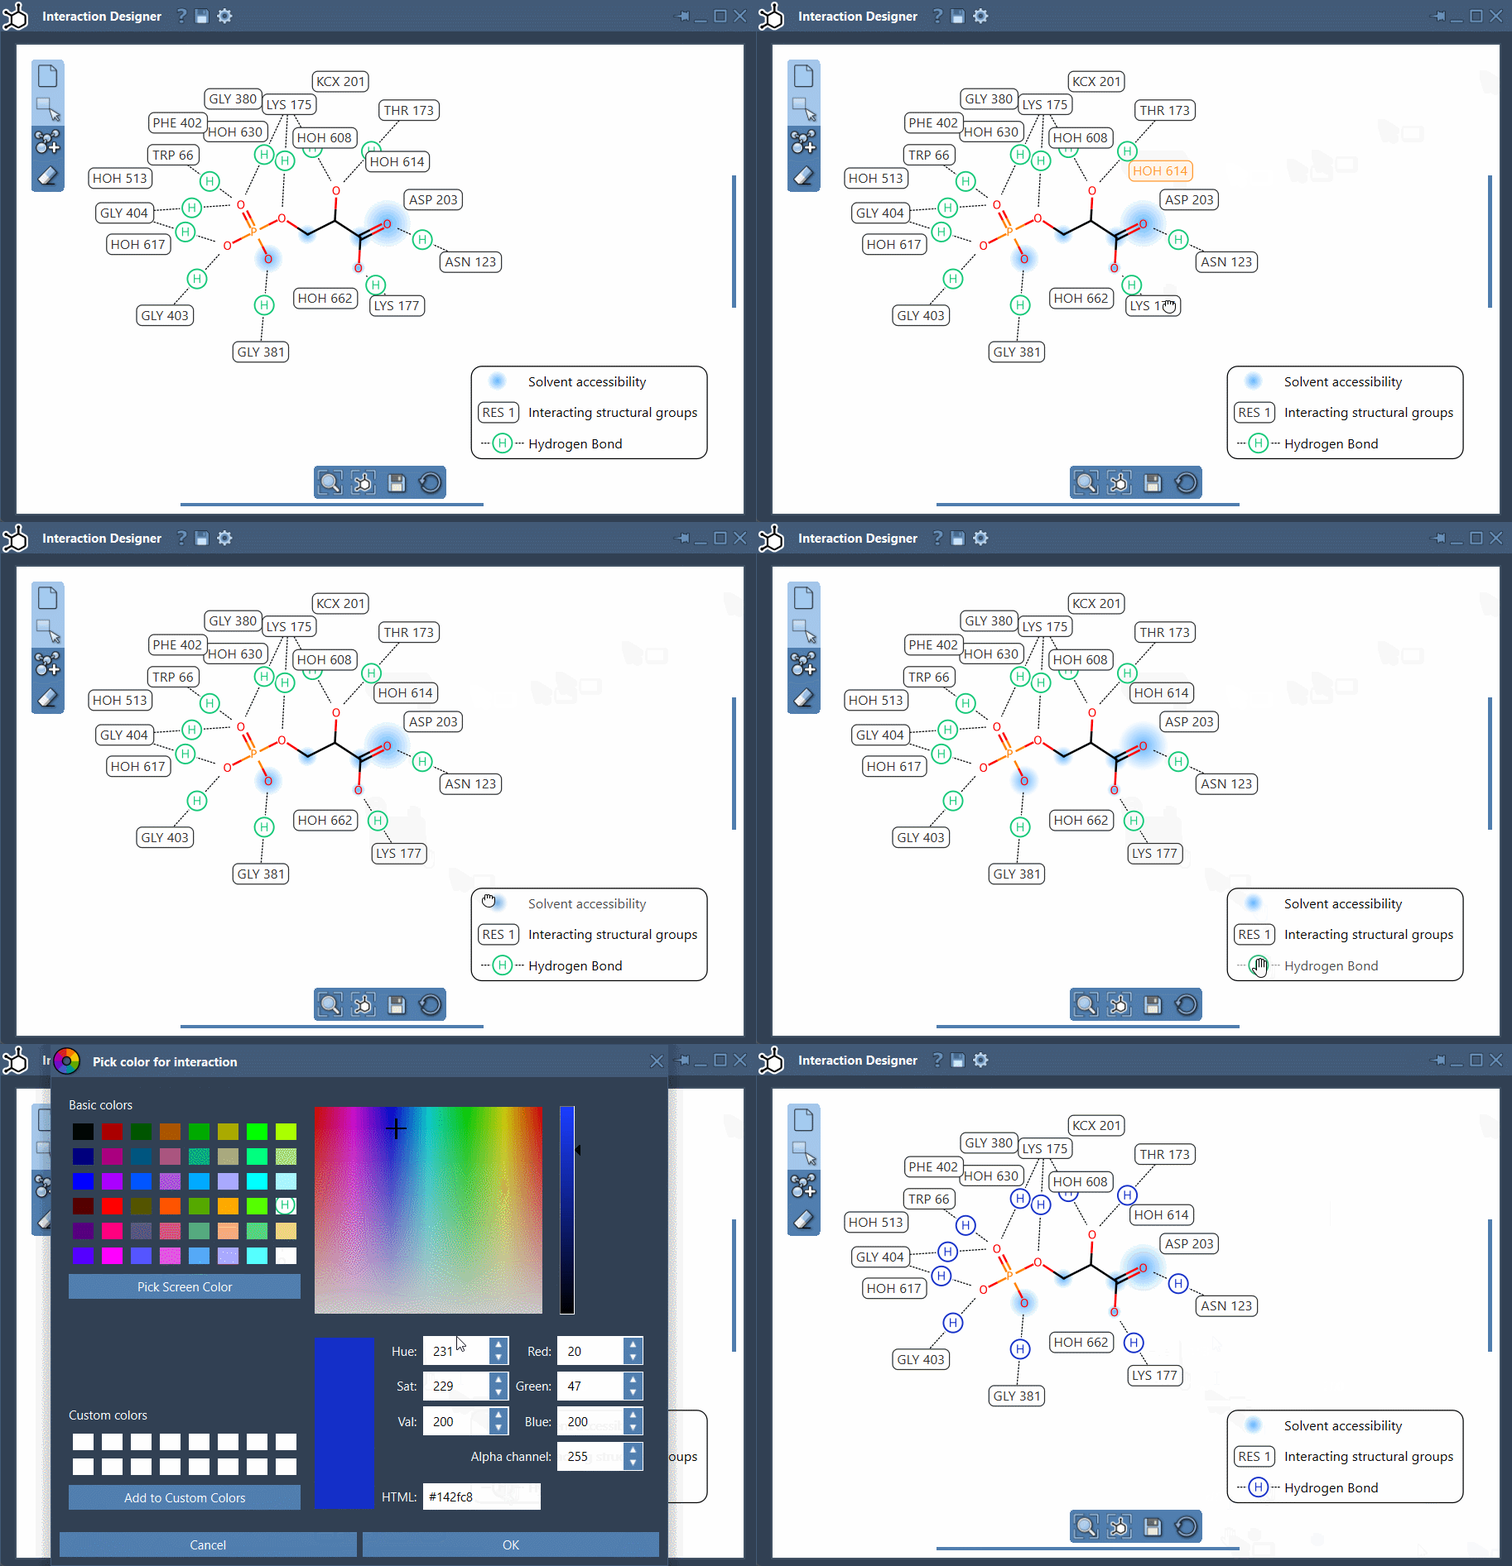
A practical order is to first inspect the diagram with all available categories visible, then hide categories that are not relevant to the question you are presenting. Adjust the remaining labels so they do not obscure the ligand or one another. Keep enough context to make the figure understandable: a cleaned-up diagram should clarify the structure, not conceal information that matters.
Use the bottom menu to update the view and align the 2D and 3D views. To zoom, hold Ctrl or Cmd while scrolling. To translate the diagram, hold the middle and right mouse buttons while moving the mouse. When the layout is ready, use Save in the bottom panel to export an image in formats such as PNG, JPG, BMP, or SVG.
The same tool can also be used to draw molecules in 2D with Edit > Design, but for reviewing a protein–ligand pose, the key benefit is the linked workflow: inspect a contact in the diagram, locate its atoms or structure in 3D, and refine the display so the evidence is clear to others.
For details on creating diagrams and the implemented contact categories, see the Interaction Designer documentation.
Note: SAMSON and all SAMSON Extensions are free for non-commercial use. Get SAMSON.