



A protein motion can look smooth in a molecular viewer and still conceal a backbone change worth investigating. A loop may shift between conformations, a residue may become an outlier, or a transition may be difficult to spot by watching the structure move frame by frame. That is a familiar pain when you are trying to understand what a path actually contains—not just what it looks like.
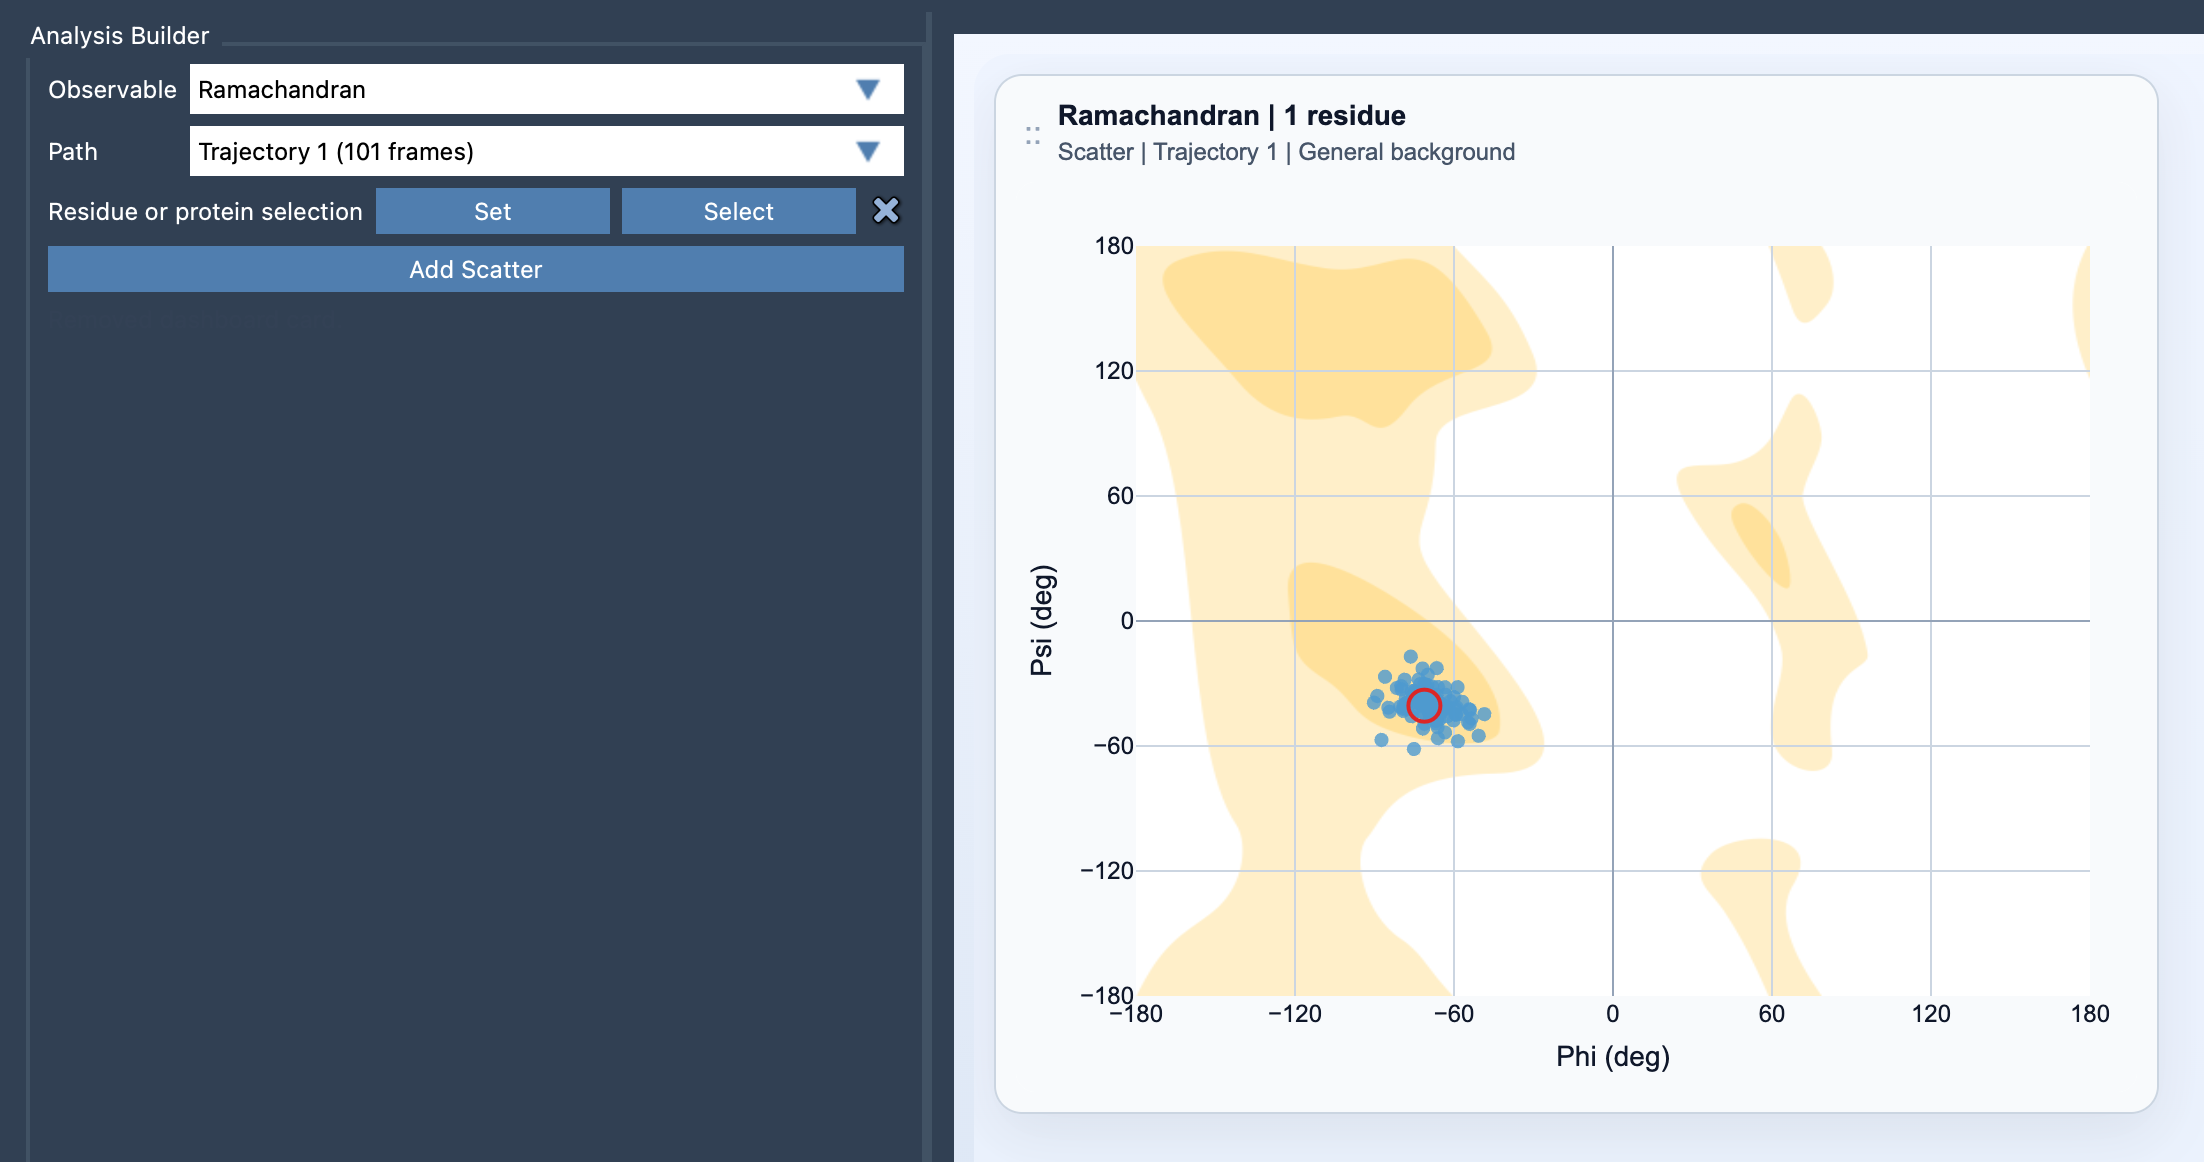
A Ramachandran plot offers another view. Instead of showing where atoms are in three-dimensional space, it plots backbone dihedral angles: phi on the horizontal axis and psi on the vertical axis. In SAMSON’s Path Analyzer, the plot can show these values for selected protein residues across a path. This makes it easier to inspect backbone conformations and see how they change along the motion.
From a moving structure to a residue-level question
The plot is most useful when you begin with a question. Are you following a particular loop? Does a residue near an active site change conformation? Do you want to examine the backbone more broadly across a protein? Your selection determines which residues contribute points, so it helps to match the selection to the scale of the question.
For a focused investigation, select the residues in the loop, motif, or active site you care about. A narrower selection makes it easier to keep your attention on the region of interest. For a broad overview, select more of the protein to see a larger picture of conformational sampling. The selection must contain atoms belonging to protein residues; each valid residue contributes phi/psi points across the path.
Adding the plot
- Open Path Analyzer.
- Choose Ramachandran as the observable.
- Choose the path you want to inspect.
- Define a residue or protein selection.
- Click Add Scatter.
The resulting scatter plot places phi on the x-axis and psi on the y-axis. Each point is associated with a residue and a frame along the selected path. This changes the inspection task: rather than relying only on visual comparison of structures, you can ask whether the backbone angles of a residue move as the path progresses.
Use the plot to investigate, not to guess
A point that draws your attention is a useful lead, not a complete explanation. The plot helps you locate a conformation or transition to inspect; it does not, by itself, explain why the change occurred or establish its biological significance. Use the rest of your structural context to decide what the observation means.
The plot is interactive, which makes that follow-up practical. Click a point to move the path to its corresponding frame. You can then inspect the structure at that moment. Double-click a point to select the corresponding residue in SAMSON, making it easier to connect a feature in the plot with the residue in the molecular scene.
A useful routine is to start with the region you care about, identify a point or change worth examining, and then move to its frame. Inspect the selected residue and its surroundings in the structure. If the question concerns a larger motion, repeat the inspection with a broader selection. Keeping the question and selection aligned can make a dense plot easier to interpret.
Put the angles in context
Backbone angles are one part of the story. For a wider view, compare the Ramachandran plot with Secondary structure content and RMSD. These complementary views can help you relate changes in phi/psi space to secondary-structure patterns and overall structural differences. They do not replace inspecting the structure, but they give you different ways to frame the same path.
Path Analyzer chooses a suitable background for the plot automatically, and you can change it later in the card settings. If you want to learn more about the plot and its inputs, see the Ramachandran documentation.
Note: SAMSON and all SAMSON Extensions are free for non-commercial use. Get SAMSON.