



A molecular structure can shift, rotate, and rearrange at the same time. That makes a simple comparison between two frames hard to interpret: a large change in position on screen does not necessarily mean the molecule changed internally, while a flexible region may move substantially even when the rest of the structure stays nearly fixed.
RMSD helps separate these effects—but the result depends on which atoms you use for alignment and which atoms you measure. In SAMSON’s Path Analyzer, these are two distinct selections: the fit set aligns each frame to the first frame, and the measured set is compared with its position in that first frame after alignment.
Choose the question before choosing the atoms
If you want to track whether an entire structure changes shape, a broad measured set may be appropriate. If you want to focus on a loop or another mobile region, measure that region while fitting a stable core. The alignment removes the core’s overall translation and rotation, making the local rearrangement easier to see in the RMSD.
This distinction is important because RMSD is not a property of a trajectory alone. It is the deviation of a specified measured set, under a specified alignment, from the first frame. Change either selection and you may get a different, but still valid, answer to a different question.
What Path Analyzer compares
For each frame t, Path Analyzer aligns the frame to frame 0 using the fit set. It then calculates the root mean square of the distances between the measured-set positions and their corresponding positions in frame 0. In compact form:
RMSD(t) = sqrt[(1/N) × Σᵢ ‖r̃ᵢ(t) − rᵢ(0)‖²]
Here, N is the number of measured positions, r̃ᵢ(t) is the position of measured feature i in frame t after fitting, and rᵢ(0) is its position in the first frame. The fit set determines the alignment; it is not necessarily the same as the measured set.
A practical way to avoid misleading comparisons
- Start with the biological question. Are you interested in overall structural deviation, or movement in a particular region?
- Pick a fit set that matches the comparison. A stable core, backbone, or binding-site scaffold can provide a reference for aligning frames.
- Pick the measured set separately. Use the whole structure for a broad view, or a flexible region to examine local motion relative to the chosen fit.
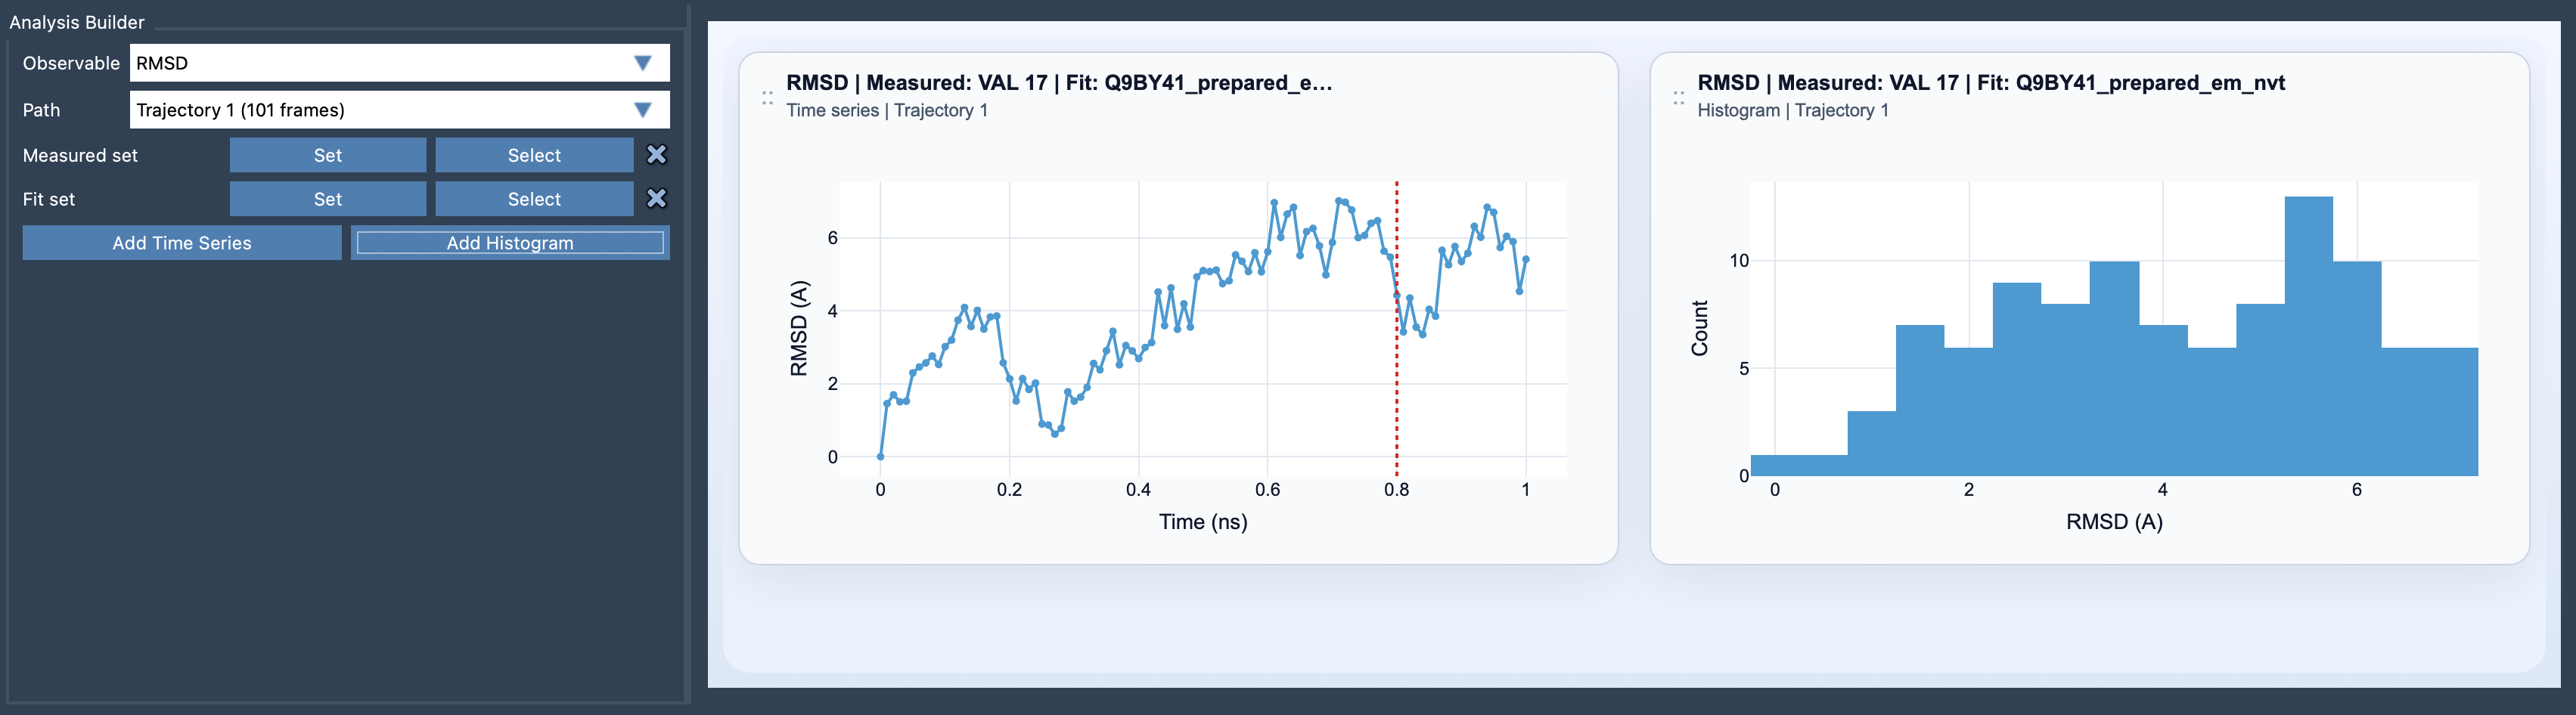
- Check the trend, not just one value. A time series shows when deviations occur; a histogram summarizes the distribution of sampled RMSD values.
A high RMSD should be read in context: it says that the selected measured positions differ from their first-frame positions after the chosen fit. It does not, by itself, identify the cause of the change. Pairing RMSD with other observables such as distance, energy, or radius of gyration can help investigate what accompanies a large excursion.
In Path Analyzer, add the RMSD observable, choose a path, define the measured and fit sets, and select Add Time Series or Add Histogram. Clicking a point moves the path to that frame; double-clicking selects the measured features in SAMSON. These interactions make it easier to connect a plot feature with the structure that produced it.
For the full RMSD reference, see the Path Analyzer RMSD documentation.
Note: SAMSON and all SAMSON Extensions are free for non-commercial use. Get SAMSON.