Running umbrella sampling simulations is a major step in estimating free energy profiles along reaction coordinates. But for molecular modelers, a recurring problem is not knowing whether the simulation data you’ve generated is enough—or balanced enough—to perform reliable Potential of Mean Force (PMF) analysis. It’s not unusual to run long simulations, only to realize later that parts of the reaction coordinate are poorly sampled. This can drastically affect the quality of your free energy estimates.
If you are using the GROMACS Wizard in SAMSON, there’s a simple way to spot exactly that.
Histogram visualization to the rescue
When you switch to the WHAM Analysis tab in GROMACS Wizard, you can load simulation results from your umbrella sampling runs. The Wizard reads reaction coordinate information, timeframes, and temperature automatically, especially if you use the auto-fill button:
![]()
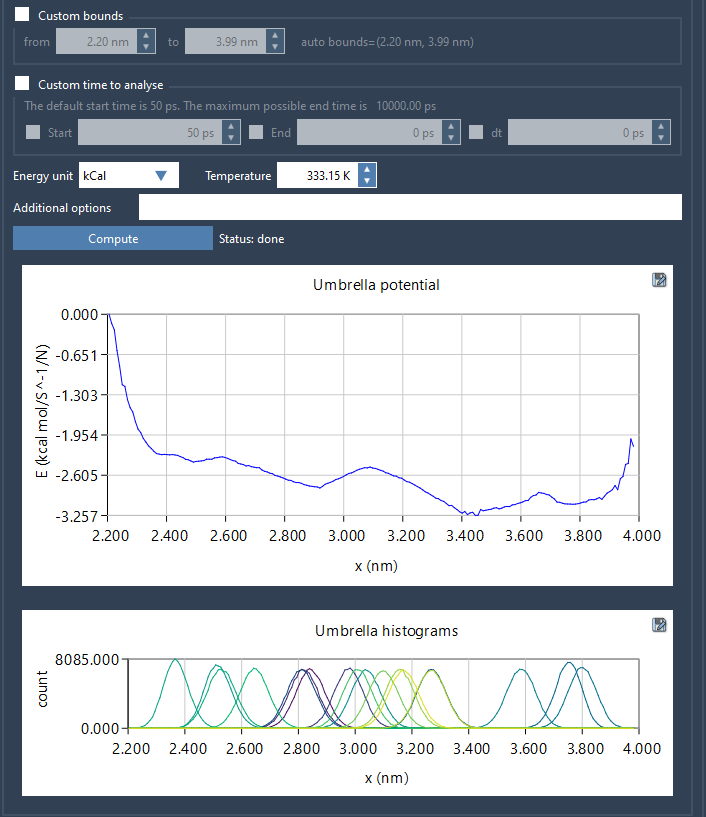
Once you’ve selected a reaction coordinate and chosen other options—such as custom bounds or time—you can click Compute. GROMACS Wizard will then process the results using WHAM and display two useful plots: the PMF and the histogram.

Why the histogram matters
The histogram is not just a visual add-on. It’s an essential diagnostic tool. It shows the distribution of simulation data along the chosen reaction coordinate, essentially informing you how much data was collected at every point on that path. If some bins are empty or significantly underpopulated, you can immediately identify regions where additional simulations may be needed.
This saves you from blindly rerunning simulations or guessing where to refine. Especially for larger systems or longer sampling windows, this kind of feedback is critical.
Efficient reuse of results
Results—profiles, histograms, and graphs—are automatically stored in a wham_results subfolder. This means when you switch between reaction coordinates or modify parameters, GROMACS Wizard reuses existing output rather than recomputing everything from scratch. Not only does this save time, it makes it easier to compare different analysis conditions on the same dataset.
Organizing input data
For the analysis to work correctly, input folders should follow a clear structure: the project directory must contain numbered subfolders from each umbrella sampling window. If the simulations were run as part of a batch computation, this will already be taken care of. Otherwise, make sure each subfolder contains the outputs of simulations for the same system and reaction coordinates.

PMF analysis is rarely a one-and-done process. That’s why having real-time insights into your data quality—especially through something as simple and useful as a histogram—can help you fine-tune your simulations and save time in the long run.
Learn more in the GROMACS Wizard documentation: https://documentation.samson-connect.net/tutorials/gromacs-wizard/pmf-analysis/
SAMSON and all SAMSON Extensions are free for non-commercial use. You can get SAMSON at https://www.samson-connect.net.


