


One of the recurring challenges in protein modeling is refining structures to ensure that all residues adopt energetically favorable conformations. Residues with dihedral angles in disallowed regions can introduce errors in simulations or reduce structural quality in homology models. But what if you could interactively see these problematic residues and adjust them directly? This is where the Interactive Ramachandran Plot in SAMSON comes in handy.
The Ramachandran plot is a cornerstone of structural validation: it maps out the allowed φ (phi) and ψ (psi) backbone dihedral angles. Residues positioned outside allowed areas signal potential trouble. Fortunately, SAMSON’s Interactive Ramachandran Plot lets you do more than just visualize them—it allows you to edit them with real-time 3D feedback.
Spotting Problems at a Glance
To begin, open your protein structure—this example uses PDB ID 1YRF—and navigate to the Ramachandran Plot app via Home > Apps > Biology. Click Update, and you’ll see the Ramachandran plot fill with dots, each representing a residue:
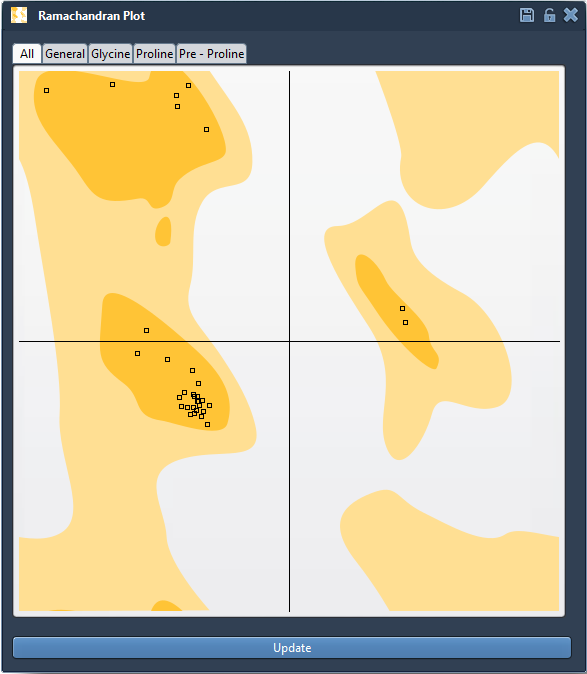
Yellow areas indicate permissible regions, while white areas mark unfavorable conformations. Residues displayed outside a yellow region should be inspected and potentially adjusted.
Edit Without Guessing
There are two main ways to revise problematic residues:
1. Drag in the Plot
- Select a residue by clicking on its dot.
- Drag the point into a favored region.
- The 3D conformation updates live as you drag.
- Undo any step with Ctrl/Cmd + Z.
This simple method works best when you need to correct a small number of outlier residues.
2. Twist in 3D Space
Alternatively, for more nuanced control, you can use the Twister editor found in the left-hand toolbar:
- Select the Twister icon.
- Rotate the backbone segments in the 3D viewport.
- Watch the Ramachandran plot update live to reflect the changes.
This approach is particularly useful when broader movements are needed to correct local strain while maintaining overall structure.
Combining with Normal Modes
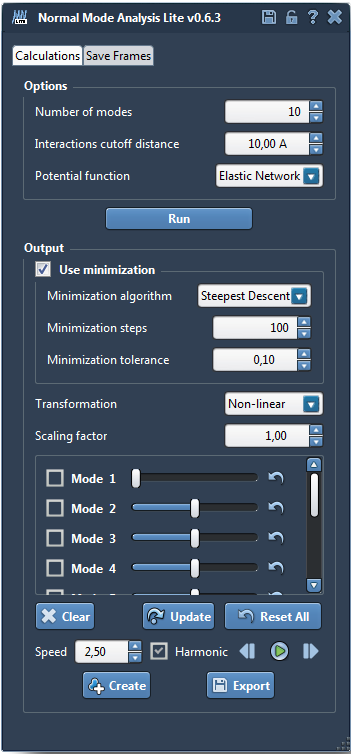
For a more advanced refinement, try coupling this tool with normal mode analysis. Compute non-linear normal modes and shift a mode to generate larger global motions. Then use the Ramachandran plot to fine-tune local conformations into allowed zones. This combination helps optimize structure while respecting dynamics.
Why This Matters
Ensuring residues lie in favorable regions is more than academic—misplaced conformations can introduce instability or unrealistic behavior in simulations. With this interactive tool, you can go from identifying to fixing outliers in just a few clicks, seeing exactly how your edits influence both angles and structure.
It’s a simple but effective solution for anyone building or refining protein models.
To explore this feature in more detail, visit the full documentation page:
https://documentation.samson-connect.net/tutorials/ramachandran/ramachandran-plot/
SAMSON and all SAMSON Extensions are free for non-commercial use. You can download SAMSON at https://www.samson-connect.net.