


One common bottleneck in molecular docking workflows is navigating and interpreting the results after a large-scale ligand screening run. You’ve set up your systems, launched your AutoDock Vina simulations, and now you’re left with dozens—or hundreds—of poses across multiple ligands. Which results are worth pursuing? And how do you visualize and analyze them quickly without writing custom scripts?
If you’re using the AutoDock Vina Extended extension in SAMSON, you have access to a built-in, interactive suite for result exploration that lots of users overlook. This blog post focuses entirely on that: how to visualize and analyze docking results right inside your modeling environment—no additional software required.
Start with the Summary View
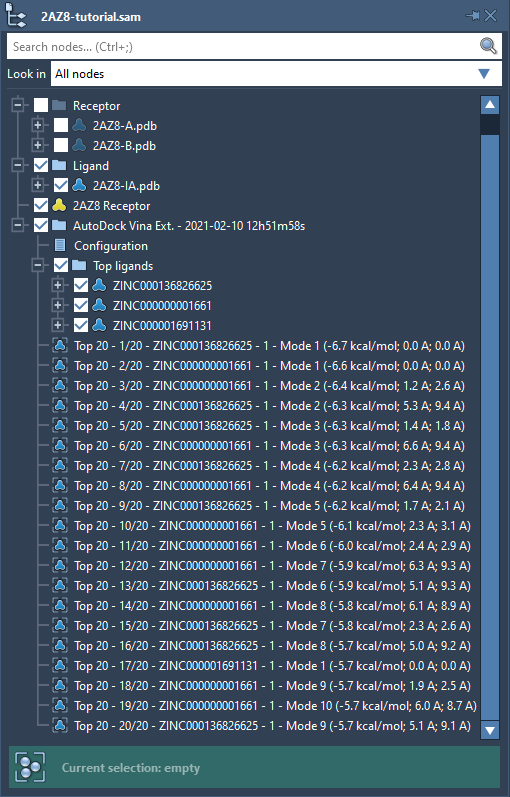
As soon as a docking campaign is complete, AutoDock Vina Extended adds a handy Top ligands folder in your document. This folder includes:
- The best binding pose for each top-ranked ligand
- A
Configurationnote with all the parameters used - Subfolders for each ligand’s conformers (poses)
To quickly inspect alternatives, just double-click on any conformation to restore its 3D pose in the scene. You can also right-click a conformation to create a structural model, which allows you to view cluster patterns between conformations visually in 3D.
Dig into the Results Table and Plot
Switch over to the Results tab of the AutoDock Vina Extended app. Here, you’ll find a sortable table and a dynamic scatter plot of the best poses. This is where result filtering becomes powerful:
- Filter by affinity, RMSD, or ligand name
- Sort the table by score to isolate promising candidates
- Right-click on rows to restore or export poses not yet in the document
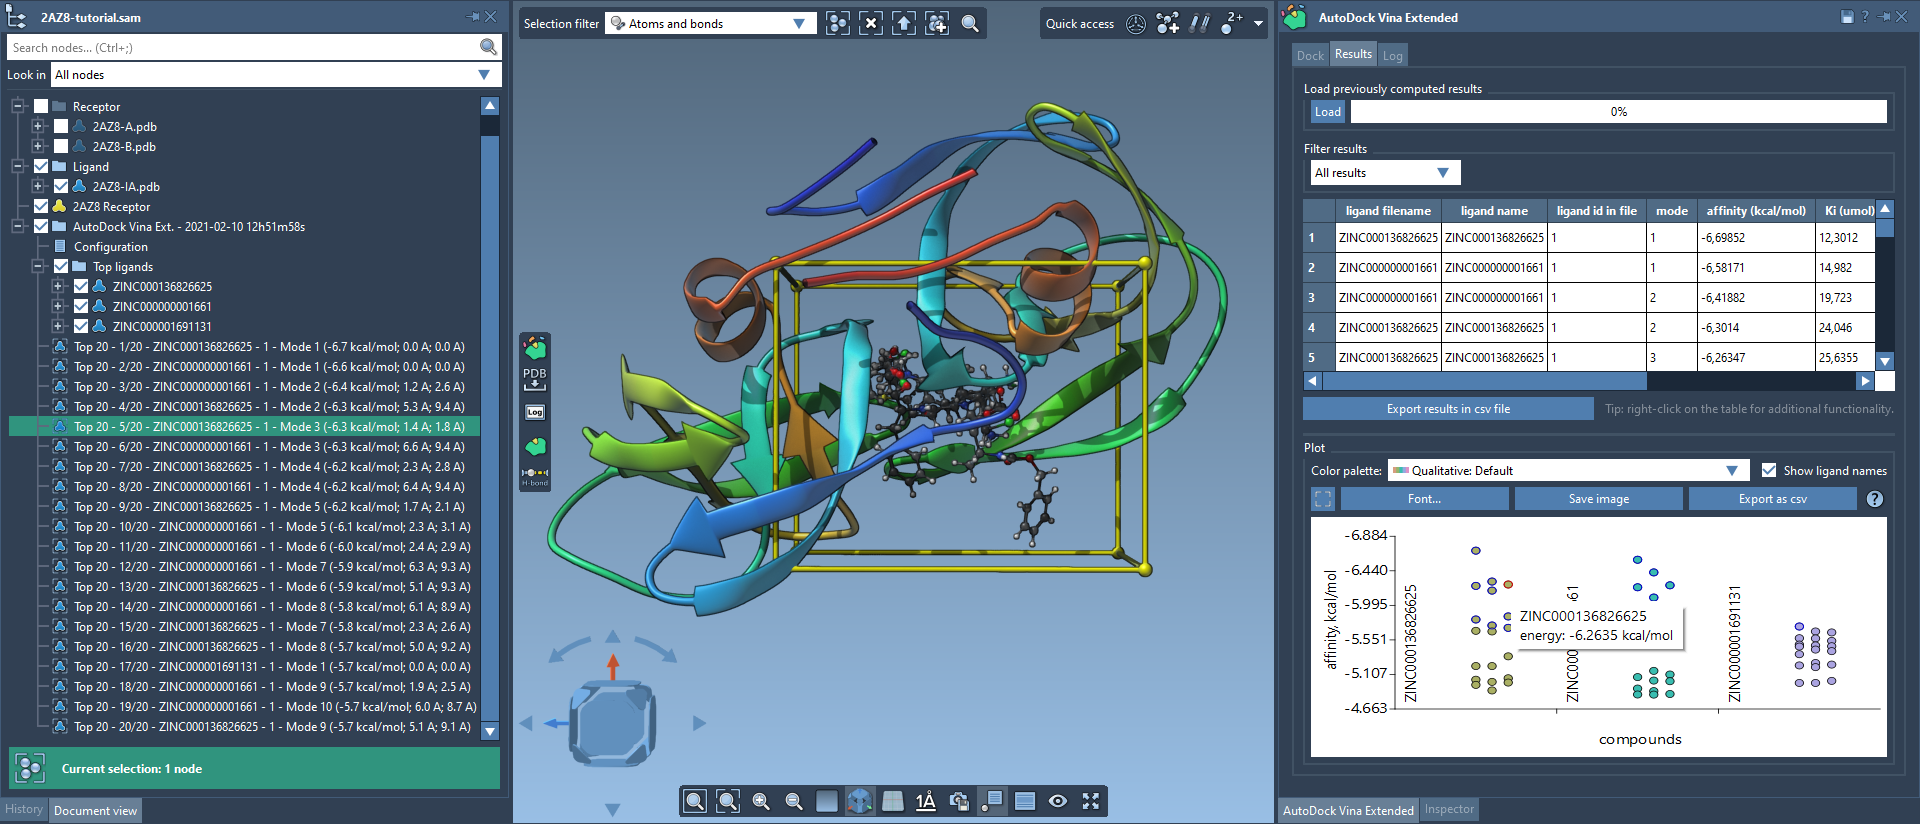
Hovering over or clicking a data point in the plot highlights the corresponding result in the Document view—and double-clicking restores the conformation in 3D. It’s a seamless way to explore conformer space!
Export What You Need
Once you’ve identified results of interest, you can export structures by selecting them and using Home > File > Save selection as…. This allows you to archive your top poses in MOL2, PDB, or other formats for downstream visualization or statistical analysis.
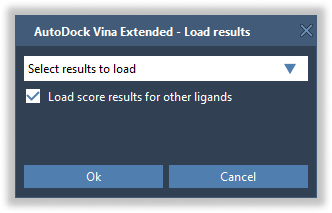
No Time Lost on Reloading
If you’ve saved your docking results earlier, you don’t need to repeat the full docking run. Just open a new document and click Load in the Results tab to import:
- Only scores (fast)
- Top ligands only
- Your choice of specific ligands
- All ligands (slower, but comprehensive)
Why This Matters
Efficient post-docking analysis is often underestimated, but it can significantly accelerate lead selection by letting you focus only on what matters. The ability to load, visualize, compare, and export top hits without ever switching software eliminates friction—and allows quicker iteration in your design process.
To learn more about using AutoDock Vina Extended in SAMSON, visit the full tutorial page.
SAMSON and all SAMSON Extensions are free for non-commercial use. You can get SAMSON here.