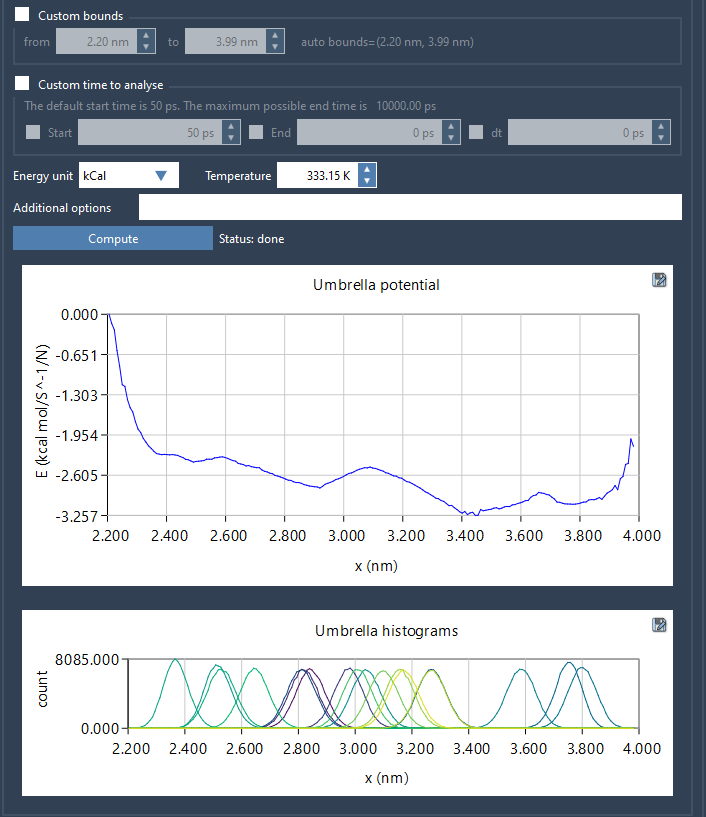
One common challenge in molecular simulations is to verify whether our sampling is sufficient. When running umbrella sampling simulations, generating and analyzing the Potential of Mean Force (PMF) is a standard step, but it’s not always easy to understand if we’ve sampled enough configurations across the reaction coordinate space. This is where GROMACS Wizard in SAMSON can help.
In this post, we walk through a central feature of the PMF analysis process in the GROMACS Wizard: a step that not only computes the PMF using WHAM but also visually informs whether you need additional sampling based on histogram coverage.
Finding Weak Spots in Sampling
Once you switch to the WHAM Analysis tab of the GROMACS Wizard, you’ll be prompted to provide a path to your umbrella sampling project folder. If you’ve previously performed umbrella sampling, an auto-fill option makes it easier to select the right folder:

The folder structure should include numbered subfolders, each corresponding to a separate simulation window. Each of these should have been set up using identical systems and reaction coordinates, differing only in their respective umbrella potentials.

Visual, Quantitative Feedback
When you hit Compute, GROMACS Wizard uses the Weighted Histogram Analysis Method (WHAM) to combine the results and output the PMF. But here’s what makes this feature especially useful: it doesn’t just give you the PMF curve.
It simultaneously plots a histogram of the sampling along the reaction coordinate. This graph can be just as critical as the PMF itself. If you notice gaps or sparse regions in the histogram, it’s a clear indication that more sampling might be required in those areas.

This means you can visually assess whether the reaction coordinate space has been uniformly sampled—or whether additional simulations should be added to improve coverage in regions where sampling is lacking.
Repeatable and Organized Output
All computed results are saved in a dedicated wham_results folder within your project directory. This not only includes the plots, but also the underlying numerical data. And when you revisit or switch between different reaction coordinates in the interface, GROMACS Wizard is smart enough to reuse already computed profiles when the parameters haven’t changed—saving you from unnecessary recomputations.
Conclusion
For molecular modelers, being able to visually confirm the adequacy of a simulation’s sampling is not just convenient—it’s essential. By leveraging the WHAM histogram provided by GROMACS Wizard, you can avoid misinterpretations of incomplete PMF curves and design better-targeted simulations.
If you want to explore this feature in more detail, visit the full documentation page here: https://documentation.samson-connect.net/tutorials/gromacs-wizard/pmf-analysis/
SAMSON and all SAMSON Extensions are free for non-commercial use. You can download SAMSON at https://www.samson-connect.net.


